Kanban Metrics: Cycle Time, Lead Time and Throughput
A practical guide to Kanban flow metrics, covering what cycle time, lead time and throughput each measure, how Little's Law links them, how to read scatterplots and cumulative flow diagrams, probabilistic forecasting, and common mistakes.

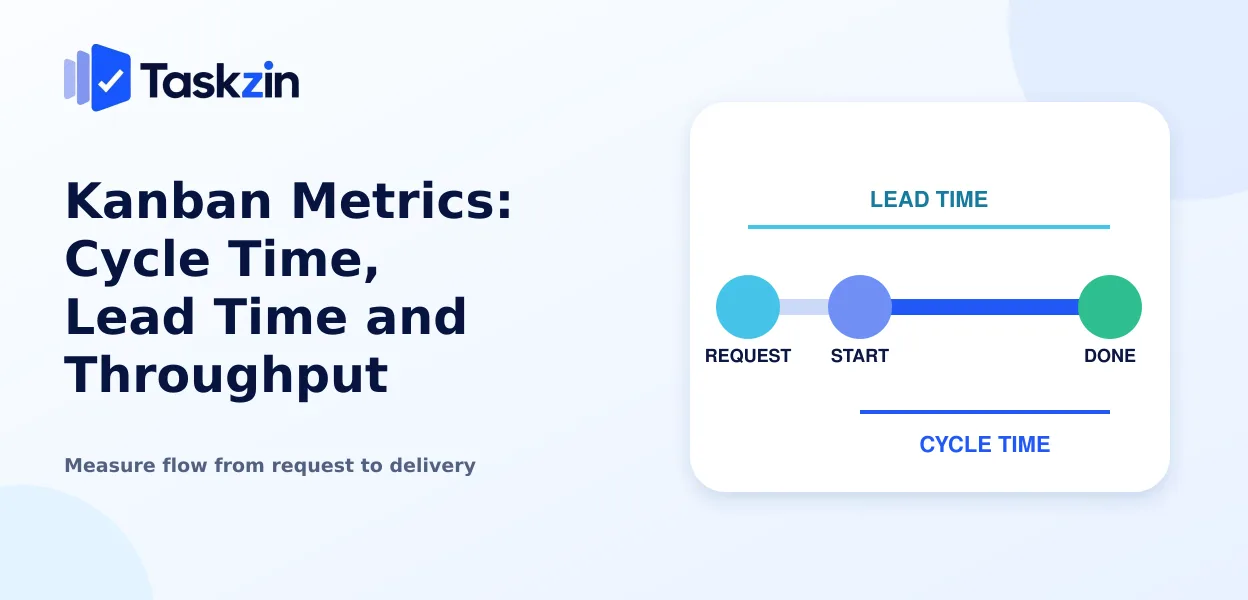
Kanban's measurements have one significant advantage over story points and velocity: nobody estimates them. They are recorded from what actually happened, which means they cannot be inflated and improvements in them are real.
Three numbers do most of the work, and they are connected by a piece of arithmetic that explains almost every delivery problem a team encounters.
This guide defines each metric, shows how they relate, explains how to read the charts, and covers forecasting without estimates.
Quick answer: Quick answer: Cycle time measures how long an item takes from the moment work starts to the moment it is done. Lead time measures from the moment it was requested, including the wait before work began. Throughput counts how many items finish per period.
Together with work in progress they describe how work flows, and Little's Law links them: cycle time equals work in progress divided by throughput.
The Three Metrics That Matter
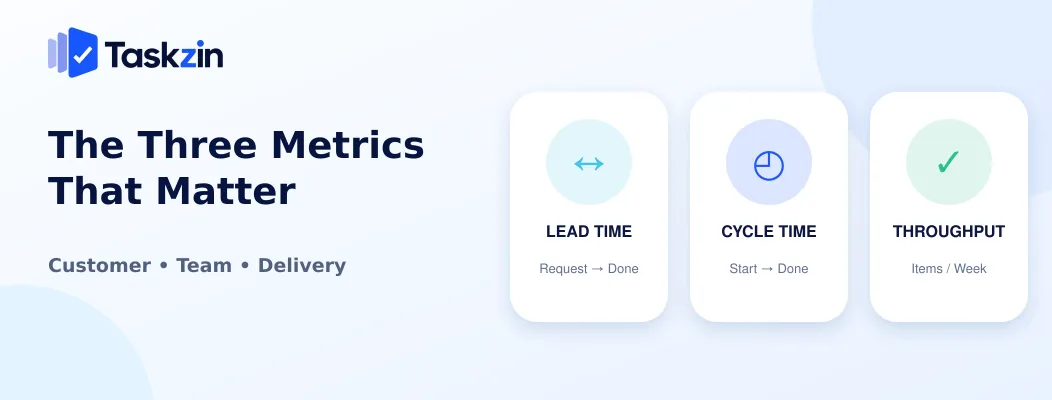
Lead time is what the customer feels, cycle time is what the team controls, and throughput is how much the team completes — the gap between lead and cycle time is your queue.
Lead time: what the customer experiences
Lead time runs from when a request is made to when it is delivered. It includes everything:
sitting in the backlog, waiting for prioritisation, the work itself, and the wait for release.
This is the number a stakeholder experiences. When someone says "everything takes forever", they are describing lead time, and a team defending itself with cycle time figures is answering a different question.
Cycle time: what the team controls
Cycle time starts when work actually begins and ends when it is done. It excludes the waiting beforehand.
Teams focus here because it is the part they influence directly. It is genuinely useful, provided you remember it is only part of what the customer sees.
Throughput: how much gets finished
Throughput counts completed items per week or per sprint. Nothing more complicated than that.
Its value is forecasting. With ten weeks of throughput history you can predict delivery ranges from data rather than from estimation, and the prediction is usually better than a points-based one.
How the Three Relate
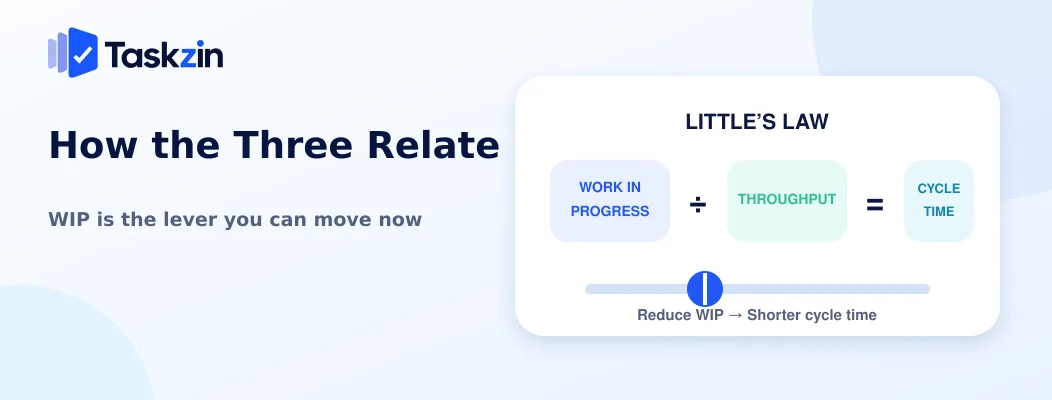
Little's Law states that cycle time equals work in progress divided by throughput — which means the fastest way to reduce cycle time is to reduce how much you have in progress.
Little's Law connects them
If a team has twenty items in progress and finishes five per week, average cycle time is four weeks. Reduce work in progress to ten and cycle time falls to two weeks, with no change in how fast anyone works.
This is arithmetic rather than a technique. It holds whether or not anyone believes it.
Why WIP is the lever
Of the three variables, work in progress is the one you can change immediately and by decision.
Throughput reflects capability and improves slowly; cycle time is an outcome rather than a control.
Setting a WIP limit is therefore the single most direct intervention available for delivery speed, and it requires no new tooling or training.
What happens when you start more work
Starting more items feels productive and lengthens cycle time for everything already in flight.
The team's output does not increase — the same throughput is now spread across more concurrent items, so each takes longer.
This is why teams can be visibly extremely busy and deliver very little in a given week.
Kanban Metrics Compared
Metric Measures Starts when Ends when Used for Lead time Total customer wait Request made Delivered Setting expectations Cycle time Active work duration Work starts Work done Process improvement Throughput Completion rate — — Forecasting Work in progress Concurrent items — — Controlling flow Flow efficiency Active vs waiting time — — Finding waste Blocked time Time unable to progress Blocked Unblocked Identifying dependencies
Reading the Charts
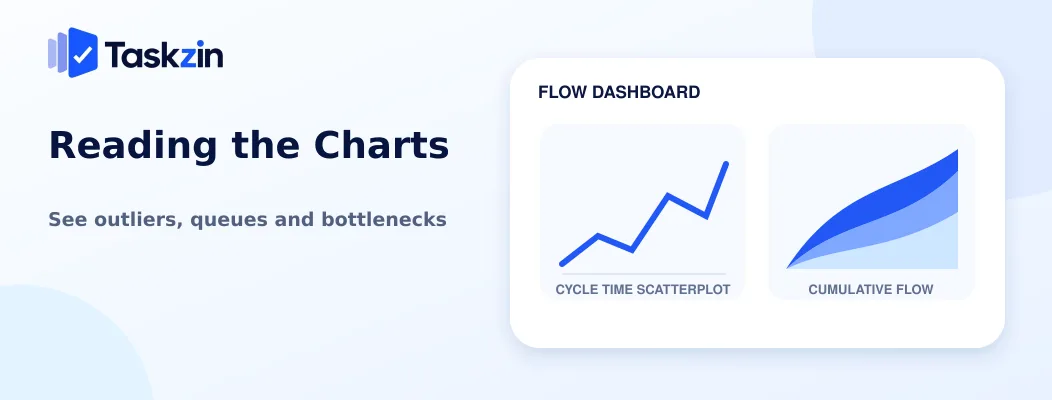
Two charts carry most of the information: a cycle time scatterplot showing the distribution of completion times, and a cumulative flow diagram showing where work accumulates.
The cycle time scatterplot
Each completed item is a dot, positioned by completion date and cycle time. Over months this produces a cloud of dots with percentile lines drawn across it.
The shape matters more than any single point. A tight cloud means predictable delivery; a widely scattered one means high variability, and variability is harder to plan around than slowness.
The cumulative flow diagram
A stacked area chart showing how many items are in each stage over time. The width of each band is the number of items in that stage.
A band that widens over time is a stage where work is accumulating — your bottleneck, visible before anyone complains about it. The overall vertical distance between the top and bottom lines is your total work in progress.
Percentiles instead of averages
Cycle time distributions are skewed: most items finish quickly and a few take far longer. An average sits somewhere unhelpful in between and describes almost nothing.
Percentiles work better. "Eighty-five percent of our items finish within nine days" is a statement you can actually plan around, whereas "our average is five days" tells a stakeholder nothing about whether their item will take five days or twenty.
Forecasting Without Estimates
With enough history, percentile figures let you make commitments probabilistically rather than by estimating each item — and a range is a more honest commitment than a single date.
Using percentiles to make commitments
If 85 percent of your items complete within nine days, you can commit to nine days with about 85 percent confidence, without estimating the specific item at all.
For larger pieces of work, throughput serves the same purpose: if you complete six items per week and a project contains thirty items, you have a five-week forecast with a confidence range attached.
How much history you need
Roughly eight to twelve weeks of consistent data before the numbers are stable enough to rely on. Less than that and you are extrapolating from noise.
The data has to be collected as work happens, which is an argument for tracking status accurately from the beginning rather than waiting until you feel organised.
Communicating a range rather than a date
"Between four and seven weeks, most likely five" is more useful and more honest than "five weeks".
Single-date commitments imply a certainty that does not exist and get treated as promises. A range with confidence attached invites a genuine conversation about risk, which is what a stakeholder actually needs in order to plan.
Common Mistakes With Kanban Metrics
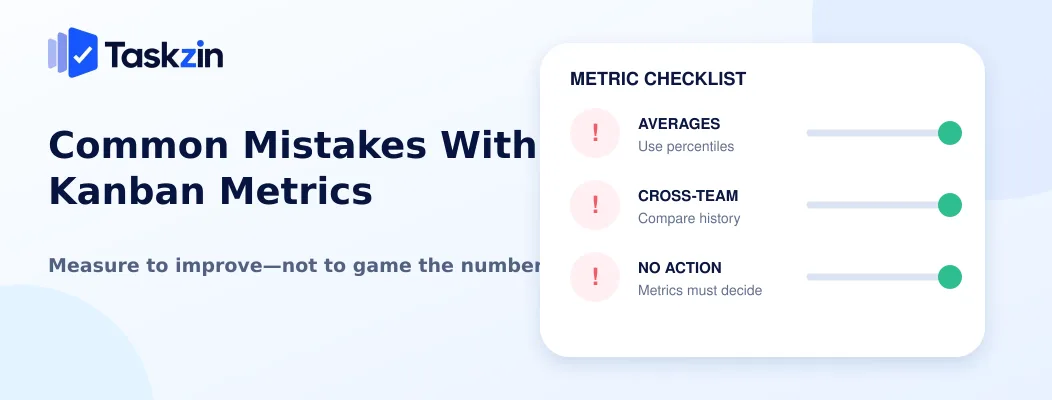
Three errors undermine flow metrics: using averages, comparing between teams, and measuring diligently without changing anything.
Using averages
Skewed distributions make averages misleading. Use the median and the 85th percentile instead.
The 85th percentile in particular is what you should quote externally, because it reflects the experience of nearly everyone rather than the typical case only.
Comparing metrics between teams
Cycle time depends on the size and nature of items, which differ across teams. Team A's four days and Team B's eight days may reflect completely different work.
Compare a team against its own history. Cross-team comparison produces gaming — splitting items smaller to improve the number without improving delivery.
Measuring without changing anything
Teams frequently instrument everything, produce charts, and continue exactly as before.
Each metric implies an action. Rising cycle time means look at WIP. A widening band on the cumulative flow diagram means address that stage. Low flow efficiency means attack the waiting. Metrics that prompt no decision are overhead.
Frequently asked
What is cycle time in Kanban?
The time from when work actually starts on an item to when it is finished. It excludes the period the item spent waiting in the backlog beforehand.
What is the difference between cycle time and lead time?
Lead time runs from the request being made; cycle time from when work starts. The gap between them is queue time, which is usually the largest single component of delay.
What is throughput in Kanban?
The number of items completed per period, typically per week. It requires no estimation and, with enough history, forecasts delivery as well as story points do.
What is Little's Law?
Cycle time equals work in progress divided by throughput. It means halving concurrent work roughly halves how long each item takes, without anyone working faster.
Why should you use percentiles instead of averages?
Cycle time distributions are skewed — most items finish quickly, a few take far longer. An average describes neither group. The 85th percentile gives a figure you can commit to.
How much data do you need to forecast?
Roughly eight to twelve weeks of consistent history. Less than that and you are extrapolating from noise rather than from a stable pattern.
Can Scrum teams use Kanban metrics?
Yes, and many do. Cycle time and throughput work alongside velocity, and they require no estimation, which makes them useful for teams questioning whether story points earn their overhead.
Binita Ray is a content writer at Taskzin, creating insightful and practical content on task management, team collaboration, productivity, workflow optimization, and SaaS solutions. She focuses on helping businesses, teams, and professionals simplify their work processes, improve efficiency, and make better use of modern productivity tools.
All posts by Binita Ray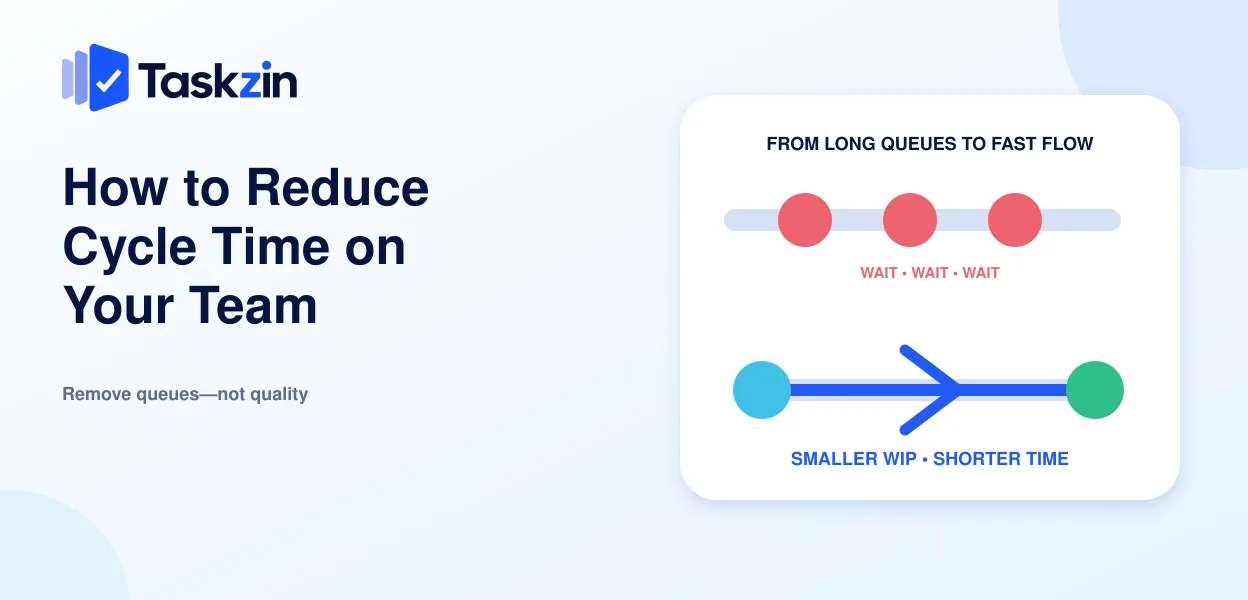

Comments