Story Point Estimation Techniques: Planning Poker and Beyond
A practical guide to story point estimation, covering what points actually measure, eight techniques compared, how to run planning poker properly, how to calibrate your team's scale, and the habits that make estimates meaningless.


Estimation attracts more argument than almost any other agile practice, largely because teams are doing two different things and calling them the same name. One team is sizing work to forecast delivery. Another is producing a number a manager will treat as a commitment. Only the first works.
This guide covers what points actually measure, eight techniques with their trade-offs, how to run planning poker properly, and how to calibrate a scale your team trusts.
Quick answer: Story points measure the relative size of work — combining complexity, effort and uncertainty — rather than the hours it will take, and the main techniques for assigning them are planning poker, t-shirt sizing, affinity estimation and the bucket system. Which technique you use matters far less than applying one consistently and never converting points back into hours.
What Story Points Actually Measure
A story point expresses how big a piece of work is relative to other work the team has done, combining complexity, effort and uncertainty into one number — deliberately, so that it cannot be read as a schedule.
The deliberate imprecision is the feature. An hours estimate invites the question "so it'll be done by Thursday?" A points estimate does not, which protects the team from a conversation that estimation cannot honestly support.
Relative size, not hours
Humans are poor at estimating absolute duration and considerably better at comparison. Asked how long a task takes, people are systematically optimistic. Asked whether it is bigger or smaller than one they finished last month, they are reasonably accurate.
Relative estimation exploits that. You are not predicting a duration; you are placing work on a scale relative to things the team already knows. Duration then emerges from velocity over time rather than being estimated directly.
Why the Fibonacci sequence is used
Most teams use a modified Fibonacci scale: 1, 2, 3, 5, 8, 13, 20, 40. The gaps widen deliberately as numbers grow.
This reflects how uncertainty behaves. The difference between a 1 and a 2 is meaningful and knowable. The difference between a 20 and a 21 is imaginary — at that size you do not have the precision to tell them apart. Forcing a choice between 13 and 20 rather than allowing 15, 16 or 17 stops teams pretending to accuracy they do not have.
What story points are not for
Points are not a productivity measure, not comparable between teams, and not a commitment.
The moment any of those three things happens, estimates inflate and the number stops describing anything real. This is not a hypothetical risk — it is the normal outcome whenever points are used for evaluation, and it is the main reason teams abandon estimation entirely.
Estimation Techniques Compared
Technique Best for Speed Precision Group size
Planning poker
Sprint-ready
Establish reference stories first
Slow High 3–9
T-shirt sizing
Roadmap-level items Fast Low Any Affinity estimation Large backlogs Very fast Medium 3–12
Bucket system
Very large backlogs Fast Medium 4–15
Dot voting
Rough prioritisation Very fast Low Any
Reference story comparison
comparison Ongoing refinement Fast Medium Any
Three-point estimation
High-uncertainty work Slow Medium Small
No estimates and throughput forecasting
Mature, consistent teams Fastest N/A Any
The Main Estimation Techniques
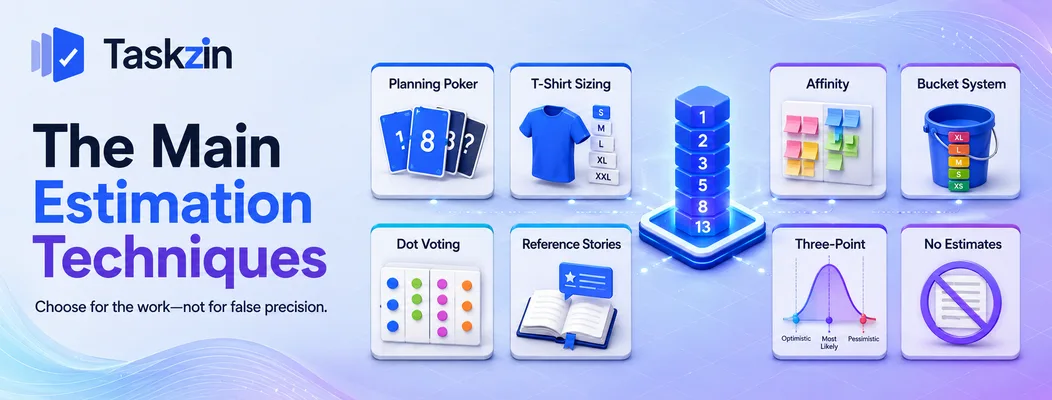
Planning poker Everyone holds a set of cards. The story is described, questions are asked, and each person selects a card privately. All cards are revealed simultaneously.
Best for: stories about to enter a sprint, where discussion has real value.
Trade-off: slow. Estimating thirty stories this way takes most of a morning.
T-shirt sizing Items are labelled extra small through extra large, with no numbers involved.
Best for: roadmap items and early-stage work where numeric precision would be false.
Trade-off: too coarse for sprint planning; sizes must be converted later.
Affinity estimation
The team lays all stories out and silently sorts them into size groups by comparison, then discusses only the ones people disagree about.
Best for: estimating a large backlog quickly — often fifty or more items in an hour.
Trade-off: less discussion, so shared understanding is thinner than with planning poker.
Bucket system Buckets are set up along a wall or board labelled with the point scale. Stories are divided among participants and placed in buckets, then everyone reviews and moves anything that looks wrong.
Best for: very large backlogs and bigger groups.
Trade-off: requires a facilitator and works best in person or on a shared canvas.
Dot voting Participants distribute a fixed number of dots across items to indicate relative size or priority.
Best for: quick rough sorting, particularly for prioritisation rather than sizing.
Trade-off: produces a rank order, not sizes.
Pick a reference story everyone remembers
The team keeps a small set of previously completed stories at known sizes. New work is estimated by asking which reference it most resembles.
Best for: ongoing refinement between formal sessions.
Trade-off: depends on maintaining good references, which teams frequently neglect.
Three-point estimation Each item gets an optimistic, likely and pessimistic estimate, combined into a weighted figure.
Best for: genuinely uncertain work where the range matters more than the number.
Trade-off: slow, and reintroduces the duration thinking relative estimation avoids.
No estimates and throughput forecasting Some teams skip sizing entirely, break stories to roughly similar size, and forecast from how many items they historically complete per sprint.
Best for: mature teams with consistent story sizes and a stable history.
Trade-off: requires eight to ten sprints of data, and stakeholders often want a number sooner than that.
How to Run Planning Poker Properly
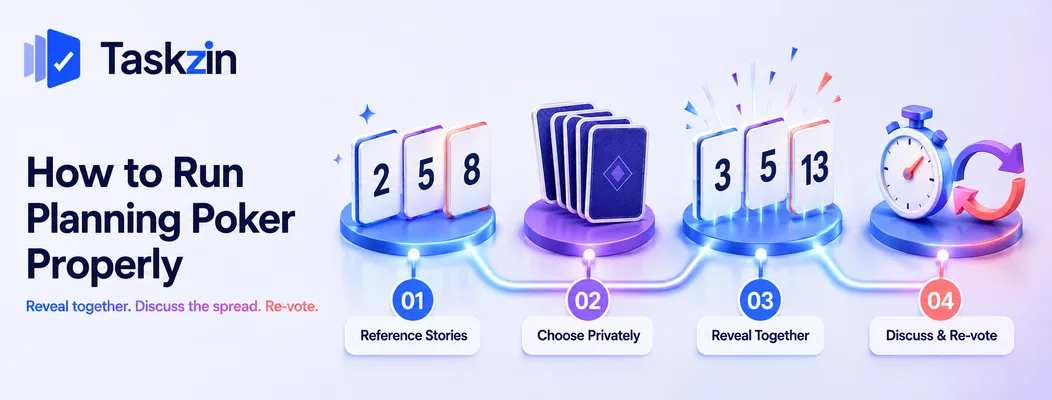
Establish reference stories before the session, have everyone reveal simultaneously so nobody anchors the group, and treat a wide spread as a signal to discuss rather than a problem to average away.
Establish reference stories first Before estimating anything, agree two or three completed stories as anchors — something everyone remembers as a 2, a 5 and an 8.
Without shared references, the first few estimates are arbitrary and everything afterwards is calibrated against an arbitrary starting point. Ten minutes on references at the start saves the session from producing numbers that mean nothing.
Reveal simultaneously, then discuss the spread
Simultaneous reveal exists for one reason: to prevent anchoring. If the tech lead says "that's a five" first, the room converges on five regardless of what anyone independently thought.
When cards differ widely — someone says 2, someone says 13 — that is the most valuable moment in the session. The gap almost always means the two people understand the story differently, and surfacing that before work starts is worth far more than the estimate itself. Ask the high and the low to explain, then re-vote.
Timebox the discussion and move on
Cap discussion at two or three minutes per story. If the team cannot converge after two rounds, the story is either too large or too poorly understood — split it or send it back to refinement.
Prolonged debate about whether something is a 5 or an 8 is not producing accuracy. The scale is not precise enough for that distinction to matter.
Calibrating Your Team's Scale
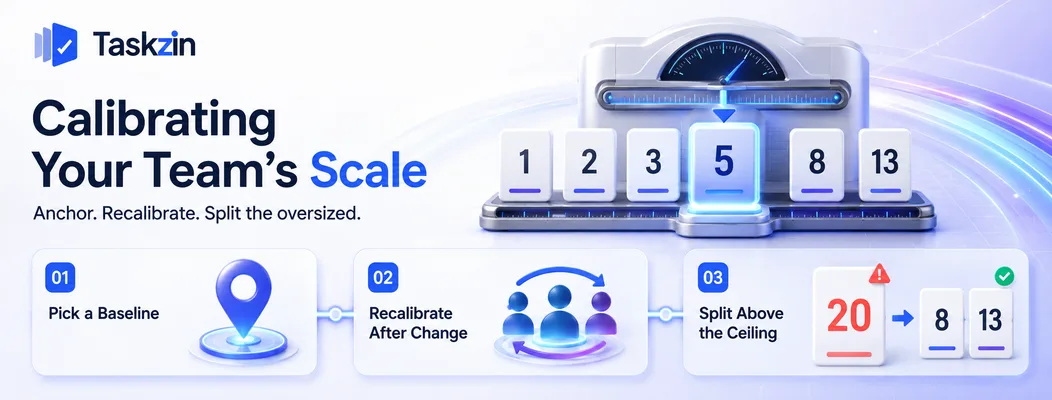
Anchor your scale to a story everyone remembers, recalibrate when the team composition changes significantly, and split anything that lands above your agreed ceiling.
Pick a reference story everyone remembers Choose a completed story of unambiguous middling size and call it your baseline — commonly a 3 or a 5. Every new estimate is a comparison to it.
Write the references down where the team can see them during estimation. Teams that rely on memory drift over months, and drifting scales make velocity history useless for forecasting.
Recalibrate when the team changes
Story points are specific to a team's capability. When several people join or leave, the scale genuinely shifts, because what was hard for the old team may be routine for the new one.
Re-establish references after significant change, and expect velocity to be unreliable for two or three sprints. This is normal and not a performance problem.
Split anything above your ceiling
Agree a maximum — commonly 13 or 20. Anything larger cannot be estimated with useful accuracy and probably cannot be completed in one sprint.
Treat a high estimate as information rather than a result: it means the story needs breaking down. This single rule improves both estimation accuracy and delivery predictability more than any technique choice.
Common Estimation Mistakes
The three habits that ruin estimation are converting points into hours, allowing senior voices to anchor the group, and comparing velocity across teams.
Converting points to hours
Publishing a conversion — "a point is roughly a day" — undoes the entire purpose. Points become hours with extra steps, and every drawback of duration estimation returns while the abstraction remains.
If your organisation genuinely needs hours, estimate in hours openly. Mixing the two produces false precision nobody trusts.
Letting the loudest voice anchor the estimate
Anchoring is the specific problem simultaneous reveal exists to solve, and it reappears whenever the process is relaxed — someone thinks aloud before the reveal, or the lead comments during the description.
Enforce the discipline. The value of group estimation comes entirely from independent judgement being surfaced before it is influenced.
Comparing velocity between teams
Points are calibrated per team. Team A's 8 and Team B's 8 have no relationship whatsoever.
Comparing velocity across teams is meaningless arithmetic that produces real consequences:
teams inflate estimates to look productive, and the numbers become useless for the forecasting they exist to support.
If you need to compare delivery across teams, use throughput — items completed per period — or cycle time. Neither depends on a locally calibrated scale, so both survive comparison in a way story points never will.
Frequently asked
What are story points in agile?
A unit expressing the relative size of a piece of work, combining complexity, effort and uncertainty. They are compared against other work the team has completed rather than translated into hours.
Why use the Fibonacci sequence for story points?
Because the widening gaps reflect how uncertainty grows with size. Distinguishing a 1 from a 2 is meaningful; distinguishing a 20 from a 21 is not, and the scale prevents teams from pretending otherwise.
How do you run planning poker?
Agree reference stories, describe each item, let everyone select a card privately, reveal simultaneously, then ask the highest and lowest estimators to explain before re-voting. Timebox discussion to a few minutes.
How many hours is one story point?
There is no conversion, and publishing one defeats the purpose. Points express relative size; duration emerges from velocity over several sprints rather than from a fixed exchange rate.
What is the best estimation technique for a new team?
Planning poker, because the discussion builds the shared understanding a new team lacks. Move to faster techniques such as affinity estimation once the team has calibrated references.
Should you estimate bugs and spikes?
Most teams timebox spikes rather than estimating them, since the work is investigation. Bugs are estimated by some teams and not others — what matters is consistency, so velocity remains comparable sprint to sprint.
Can agile teams work without estimating?
Yes. Teams that break work into similarly sized items can forecast from throughput — how many items they complete per sprint — which requires eight to ten sprints of history to be reliable.
Binita Ray is a content writer at Taskzin, creating insightful and practical content on task management, team collaboration, productivity, workflow optimization, and SaaS solutions. She focuses on helping businesses, teams, and professionals simplify their work processes, improve efficiency, and make better use of modern productivity tools.
All posts by Binita Ray
Comments