What Is Velocity in Scrum and How Do You Calculate It?
A clear explanation of velocity in Scrum, covering what it measures, how to calculate it with a worked example, how to use it for range forecasting, what makes it unstable, and why it is so often misused.


Velocity is simple to calculate and easy to misuse. Used as a forecasting input it works well; used as a target it corrupts within a couple of sprints, because the team controls the estimates that produce it.
This guide covers what velocity measures, how to calculate it with a worked example, how to forecast responsibly, and why it goes wrong.
Quick answer: Velocity is the number of story points a team completes in a sprint, counted only for work that fully meets the definition of done. You calculate it by adding the points of all completed items, then averaging across the last three to five sprints to get a figure you can forecast with. It is a planning aid for one team over time — not a productivity measure and not comparable between teams.
What Velocity Measures
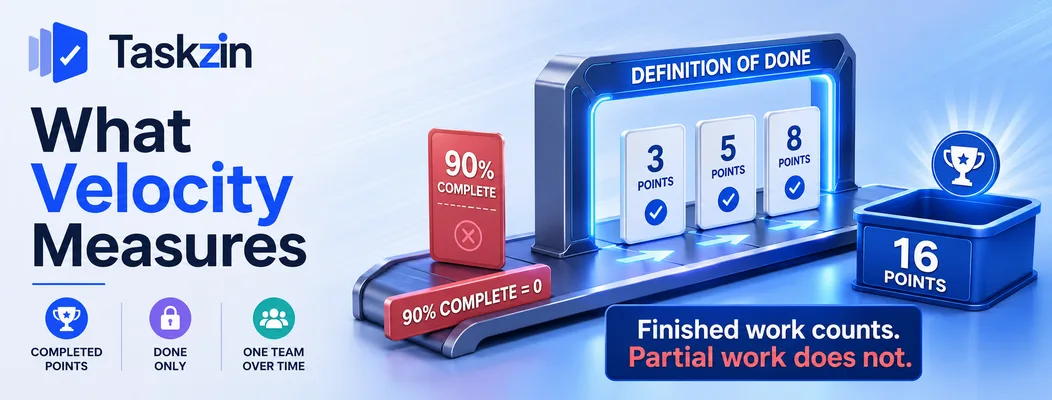
Velocity counts completed story points per sprint, using only items that fully satisfy the definition of done.
Completed points per sprint
At sprint end, add the story point values of every item that is finished. That total is the sprint's velocity.
Nothing more complicated is involved. The subtlety lies entirely in what counts as finished and in how the figure is used afterwards.
Why only finished work counts
An item that is 90 percent complete contributes zero. This feels harsh and is deliberate.
Partial credit destroys the metric, because "nearly done" is unmeasurable and consistently optimistic. The all-or-nothing rule also creates useful pressure toward finishing work rather than starting more, which is generally the behaviour you want.
What velocity is not
It is not a measure of productivity, effort or value. It is not comparable between teams, because story points are calibrated locally.
It is also not a target. A team asked to increase velocity can do so within one sprint by estimating more generously, which produces a rising number and no additional delivery.
How to Calculate Velocity
Sprint Committed points Completed points Notes 1 34 21 New team, learning 2 30 26 — 3 28 29 —
4 30 27 Two days' leave 5 30 31 — **Average (last 3)** — **29** Use for forecasting **Range (last 3)** — **27–31** Use for range forecasts
Sprint 1 is excluded from the average as an outlier — early sprints are unrepresentative.
Using Velocity to Forecast
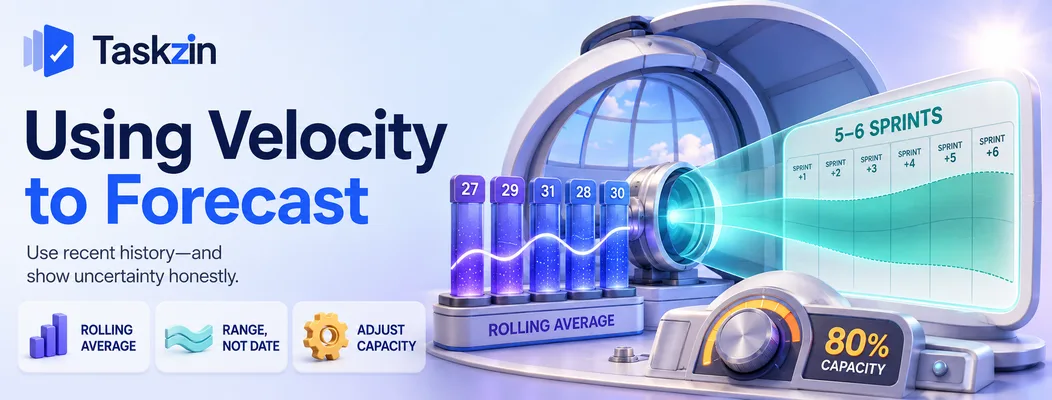
Forecast with a rolling average of the last three to five sprints, express the result as a range rather than a date, and adjust for known capacity changes rather than reusing last sprint's number.
Use a rolling average, not one sprint
Any single sprint contains noise — an incident, a holiday, an item that turned out to be larger than assumed.
Averaging the last three to five sprints smooths this out. Rolling the window forward means the figure reflects the current team rather than one from six months ago.
Forecast a range, not a date
If the backlog holds 150 points and velocity ranges from 27 to 31, the remaining work takes roughly five to six sprints.
Presenting that as a range is more honest and more useful than a single date. Stakeholders who receive a range understand it as an estimate; those given a specific date treat it as a commitment, and the difference matters when something slips.
Adjust for capacity, don't reuse blindly
Velocity describes past sprints under past conditions. If two people are on leave next sprint, historical velocity overstates what is achievable.
Scale it by available capacity. If the coming sprint has 80 percent of normal capacity, plan for around 80 percent of average velocity. This is the step most commonly skipped, and it is the main reason teams commit to more than they can deliver.
What Makes Velocity Unstable
Velocity fluctuates when story sizing is inconsistent, when the team changes, and when carryover is handled inconsistently.
Inconsistent story sizing
If a 5 means something different this month from last, velocity means nothing across the period.
Reference stories help — a small set of completed items at known sizes that new estimates are compared against. Without them, scales drift gradually and nobody notices until forecasts stop working.
Team changes
Velocity is specific to a team's composition. Adding or losing people changes it, and a new joiner typically reduces it temporarily while they learn and while someone supports them.
Expect two or three unstable sprints after any significant change. This is normal and should not be treated as a performance issue.
Carryover and partial credit
Decide once how carryover is handled — most teams count the points in the sprint where the item completes, not split across sprints.
Whichever convention you choose, apply it consistently. Changing the rule mid-history makes the numbers incomparable.
Why Velocity Gets Misused
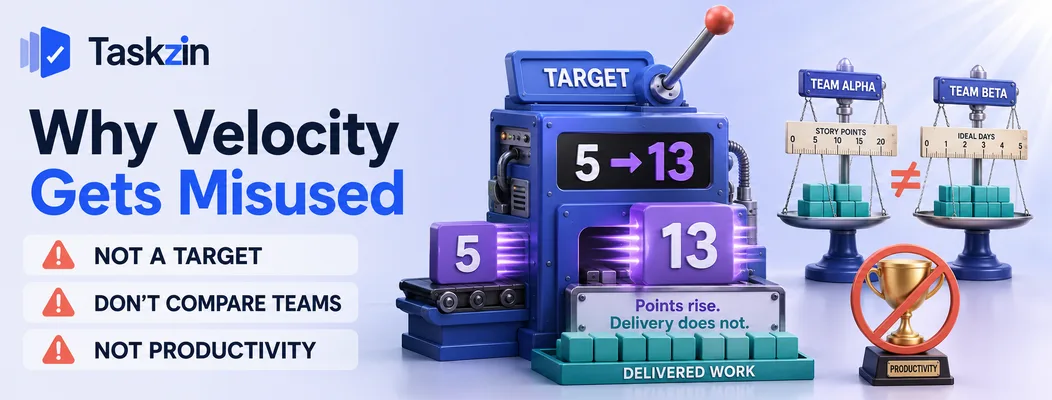
Velocity is misused when it is compared across teams, set as a target, or read as a measure of productivity.
Comparing teams
Team A's 8 and Team B's 8 have no relationship. Points are calibrated within a team.
Comparing velocity across teams produces a ranking with no meaning and a strong incentive to inflate estimates. If you need cross-team comparison, use throughput — items completed per period — which does not depend on a local scale.
Setting it as a target
The moment velocity becomes something to increase, estimates rise. The number improves and delivery does not.
This is not dishonesty; it is a predictable response to being measured on a figure you control.
The only reliable protection is not using velocity for evaluation at all.
Reading it as productivity
A sprint with low velocity may reflect difficult work, support load, or an unusually complex item — not less effort.
Velocity describes throughput of estimated work under specific conditions. Productivity is a different question, and one that story points cannot answer.
Common Velocity Mistakes
The three errors that produce misleading velocity are using it before enough history exists, counting unfinished work, and chasing an increasing number.
Using it before you have history
The first two or three sprints of a new team are unrepresentative. Forecasting from them produces confident numbers with no basis.
Wait for three to five sprints, and exclude obvious outliers such as the first sprint or one disrupted by a major incident.
Counting unfinished work
Awarding partial points for nearly-complete items inflates velocity and hides carryover. The metric then stops warning you that the team is overcommitting.
Chasing an increasing number
A team whose velocity climbs steadily quarter after quarter is usually estimating more generously rather than delivering more.
Stable velocity is a healthy sign. It means estimates are consistent and forecasts will hold, which is the entire purpose of measuring it.
Frequently asked
What is velocity in Scrum?
The number of story points a team completes in a sprint, counting only items that fully meet the definition of done. It is used to forecast how much the team can take on in future sprints.
How do you calculate velocity?
Add the story points of all items completed in the sprint. For forecasting, average the totals from the last three to five sprints, excluding obvious outliers.
How many sprints do you need before velocity is reliable?
Three to five. Earlier sprints are unrepresentative because the team is still calibrating its estimates and establishing how it works together.
Is a higher velocity better?
Not necessarily. A steadily rising velocity usually indicates estimate inflation rather than increased delivery. Stable velocity is more valuable, because it makes forecasting reliable.
Can you compare velocity between teams?
No. Story points are calibrated within a team, so the same number means different things to different teams. Use throughput — items completed per period — if you need cross-team comparison.
What is the difference between velocity and throughput?
Velocity counts estimated points completed; throughput counts items completed regardless of size. Throughput requires no estimation and is comparable across teams, which is why some teams prefer it.
What should you do if velocity is unstable?
Check story sizing consistency using reference stories, account for team changes, and confirm carryover is handled the same way each sprint. Instability usually traces to one of these three.
Sanju Shrestha is a SaaS content writer at Taskzin who explores smarter ways to manage work, organize priorities, and improve team performance. Her content covers productivity strategies, digital workflows, collaboration, and task management, with a focus on helping modern teams work more efficiently and stay aligned.
All posts by Sanju Shrestha


Comments