What Is Throughput in Agile?
An explainer on throughput in agile, covering what it measures, how it differs from velocity, how it relates to cycle time through Little's Law, how to forecast from it, and the mistakes that make it misleading.


What is throughput in agile?
Throughput is the simplest flow metric there is, and it is frequently more useful than the metrics teams spend far more effort maintaining.
Quick answer: Throughput is the number of work items a team completes in a given period — twelve items this week, forty-eight this month. It counts finished work rather than estimated effort, which makes it harder to game than velocity and directly usable for forecasting.
Throughput, Defined

A count of completed items per unit of time, with nothing estimated and nothing weighted.
What counts as an item
Whatever unit your team moves through its workflow — a story, a ticket, a task, a bug. The rule is consistency: count the same kind of thing every period.
"Completed" means it met your definition of done. An item that is coded but not reviewed has not been completed, however close it feels.
Throughput versus velocity
Velocity sums story points — an estimate of effort — for completed work. Throughput just counts the items.
The difference matters because points are estimates and estimates drift. A team under pressure to raise velocity can inflate its points without delivering more. A team cannot inflate a count of finished items without actually finishing more items.
Why it is harder to game
The only ways to increase throughput are to complete more work or to split work into smaller pieces. The second is usually a good thing anyway — smaller items flow faster and carry less risk.
That property is why many teams moving toward flow-based practice drop points entirely and forecast from throughput instead.
Throughput Alongside the Other Flow Metrics
Metric What it measures Unit Answers
Forecasting from throughput
Items completed per period Items per week How much do we finish?
Cycle time Start to finish, per item Days How long does one item take?
Lead time Request to finish, per
Mixing item sizes wildly
Days How long does the customer wait?
Work in progress Items started, not finished Items How much is in flight?
Velocity Story points completed per sprint Points How much estimated effort did we finish?
How to Measure and Use It
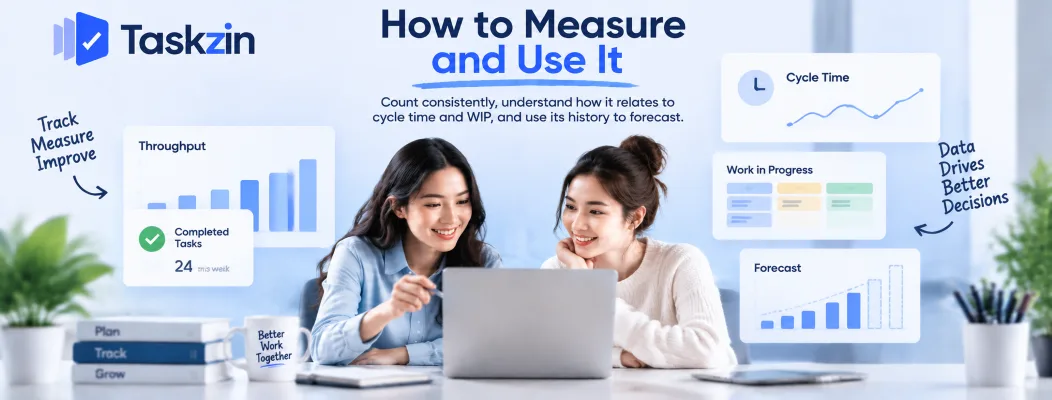
Count consistently, understand how it relates to cycle time and WIP, and use its history to forecast.
Counting it correctly
Pick a period — a week works for most teams — and count items reaching done in that period.
Record it every period, including the bad ones.
Look at the range rather than the average. A team completing between 8 and 14 items a week has a very different forecasting profile from one completing between 3 and 20, even if the averages match. Where your tool records when items move to done, throughput is a report rather than a manual tally — Taskzin's board data produces it without anyone counting.
Little's Law, with an example
Little's Law ties three metrics together: average cycle time equals average work in progress divided by average throughput.
A team with 15 items in progress and a throughput of 5 items per week has an average cycle time of 15 ÷ 5 = 3 weeks. Halve the work in progress to 7.5 items and, at the same throughput, cycle time drops to 1.5 weeks.
That is the mathematical argument for WIP limits. Starting less work, without working any faster, makes each item finish sooner.
How is throughput different from velocity?
To estimate when 60 items will be done, divide by your throughput range rather than your average. At 8 to 14 items per week, that is roughly 4.3 to 7.5 weeks.
Monte Carlo forecasting does this more rigorously — sampling your historical weekly throughput thousands of times to produce a probability distribution — and gives answers like "85 percent likely by the 14th". It is more honest than a single date, because it states the uncertainty.
Common Throughput Mistakes
Comparing across teams, turning it into a target, and ignoring wildly different item sizes.
Comparing teams
Different teams split work differently, so ten items for one team and ten items for another mean nothing comparable.
Compare a team with its own history. That comparison is meaningful and creates no incentive to game.
Treating it as a target
Once throughput becomes a goal, work gets sliced ever thinner to raise the number without delivering more value.
Use it to prompt questions — "throughput halved last month, what changed?" — rather than as something to hit.
Mixing item sizes wildly Throughput assumes items are roughly similar in size. If one item takes an hour and another takes three weeks, the count stops meaning much.
The fix is not estimating harder; it is splitting large items until they are broadly comparable.
Right-sizing makes throughput useful and improves flow at the same time.
Frequently asked
What Is Throughput in Agile?
The number of work items a team completes in a given period, such as items per week. It counts finished work rather than estimated effort.
How is throughput different from velocity?
Velocity sums story points for completed work; throughput counts the items. Throughput is harder to inflate because it cannot be raised without actually finishing more.
How do you calculate throughput?
Count the items that reached your definition of done within a period, and record it every period. Track the range as well as the average.
What is a good throughput?
There is no universal number, since it depends on how your team sizes work. The useful question is whether it is stable and whether it is improving against your own history.
What is Little's Law?
Average cycle time equals average work in progress divided by average throughput. It shows why limiting work in progress shortens cycle time without anyone working faster.
Can you forecast with throughput?
Yes. Divide remaining items by your throughput range for a date range, or use Monte Carlo simulation on historical throughput for a probabilistic forecast.
Should items be the same size?
Roughly. Throughput works when items are broadly comparable. Split large items rather than estimating them more carefully.
Sujan Sharma is a content writer at Taskzin with a strong focus on productivity systems, task management, workflow optimization, team collaboration, and SaaS technology. He creates research-driven, practical content that helps professionals and growing teams improve operational efficiency, streamline processes, and make informed decisions about modern work management tools.
All posts by Sujan Sharma

Comments