The RICE Scoring Framework for Prioritisation
A practical explanation of the RICE scoring framework, covering what each factor measures, the formula with a worked numeric example, how to score consistently across a team, how to read the results, and where the framework breaks down.

RICE gives you a number for each item on your backlog and ranks them. That is genuinely useful and also the source of its main risk: a number carries an authority that its inputs do not deserve.
Used well, RICE structures a conversation and exposes disagreement about assumptions.
Used badly, it launders guesses into decisions.
This guide explains the four factors, works through a real calculation, covers how to score consistently, and is honest about where the framework misleads.
Quick answer: Quick answer: RICE scores each item on Reach, Impact, Confidence and Effort, then ranks by the formula (Reach × Impact × Confidence) ÷ Effort. Reach is how many people are affected in a set period, Impact is how much it affects each of them on a fixed scale, Confidence is a percentage reflecting how reliable your estimates are, and Effort is total person-months. The resulting score is a prompt for discussion rather than a decision.
What RICE Measures
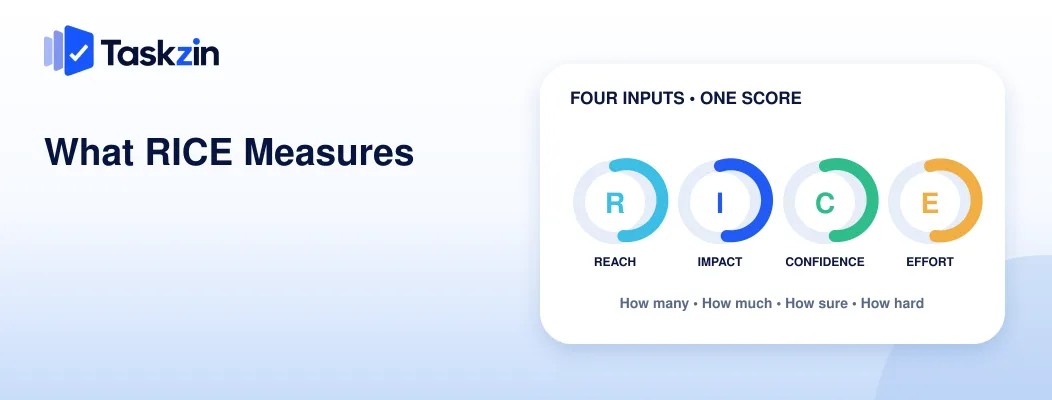
RICE combines how many people are affected, how much they are affected, how confident you are in those figures, and how much work it takes — with confidence acting as a discount on the whole estimate.
Reach: how many, in what period
The number of people or events affected within a defined time period. Users per quarter, transactions per month, tickets per week.
Fixing the period is essential and often skipped. Comparing an item scored per quarter with one scored per month makes the ranking meaningless, and it is an easy error to make when scoring in a group.
Impact: how much it moves the needle
How much the change affects each person reached, on a fixed scale — commonly 3 for massive, 2 for high, 1 for medium, 0.5 for low and 0.25 for minimal.
The scale must be fixed and shared. Left open, everyone applies a different implicit range and the numbers stop being comparable, which defeats the whole exercise.
Confidence: how much you believe the first two
A percentage — commonly 100, 80 or 50 — reflecting how well supported your reach and impact estimates are.
This factor does more work than people expect. It is the framework's mechanism for handling the difference between a well-evidenced estimate and an educated guess, and it is the factor most often left at 100 percent regardless of evidence.
Effort: person-months to deliver
Total work across everyone involved — design, engineering, testing, launch — expressed in person-months.
Effort is the denominator, so it has strong influence on the result. Underestimating effort on a favoured item is the most common way RICE gets quietly gamed.
The RICE Formula and a Worked Example
RICE score = (Reach × Impact × Confidence) ÷ Effort Four candidate features for a product with roughly 8,000 monthly active users:
Feature Reach (per quarter) Impact Confidence Effort (person-months)
Common RICE Mistakes
How to Score Consistently
Faster checkout 6,000 2 80% 2 4,800 Bulk import 800 3 100% 1.5 1,600 Dark mode 4,000 0.5 100% 1 2,000 Advanced reporting 1,200 2 50% 4 300
The ranking is checkout, dark mode, bulk import, reporting. Note what the numbers reveal: dark mode reaches many people with low impact and low effort, scoring above a feature with triple the impact for a smaller audience. Whether that is the right answer is exactly the discussion the framework should trigger.
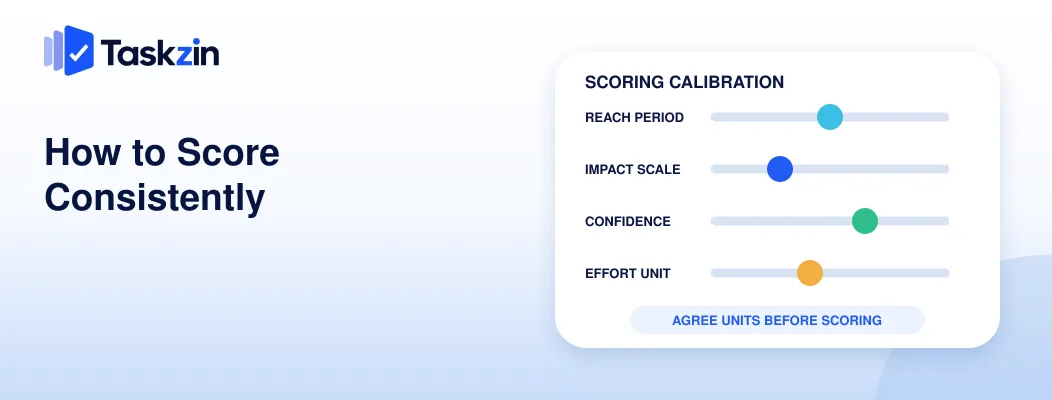
How to Score Consistently Agree the reach period, the impact scale and the effort unit before scoring anything — inconsistent inputs make the ranking arbitrary regardless of how carefully you calculate.
Agree the reach period first
Pick one — quarterly is common — and use it for every item. Write it at the top of the sheet.
Where you have no data, use the best proxy available and lower confidence accordingly. Do not invent a number and score it at 100 percent, which is the most common corruption of the method.
Use a fixed impact scale
Write the scale down with a definition for each level. "Massive: users would change their behaviour. High: noticeable improvement to a frequent task. Medium: helpful. Low: minor convenience."
Definitions make scores comparable across people and across weeks. Without them the same feature scores differently depending on who is in the room.
Be honest about confidence
Confidence is where intellectual honesty enters the framework. Evidence from user research or analytics justifies 100 percent. A plausible theory is 80. A hunch is 50.
An item scored at 50 percent confidence with a high resulting score is often better addressed by running a small experiment to raise confidence than by building the whole thing.
Estimate effort in the same units every time
Person-months, including all functions. A feature needing two engineer-months and one design-month is three, not two.
Consistency matters more than accuracy here. Systematically underestimating everything by the same proportion leaves the ranking intact; underestimating some items and not others distorts it.
Reading the Results
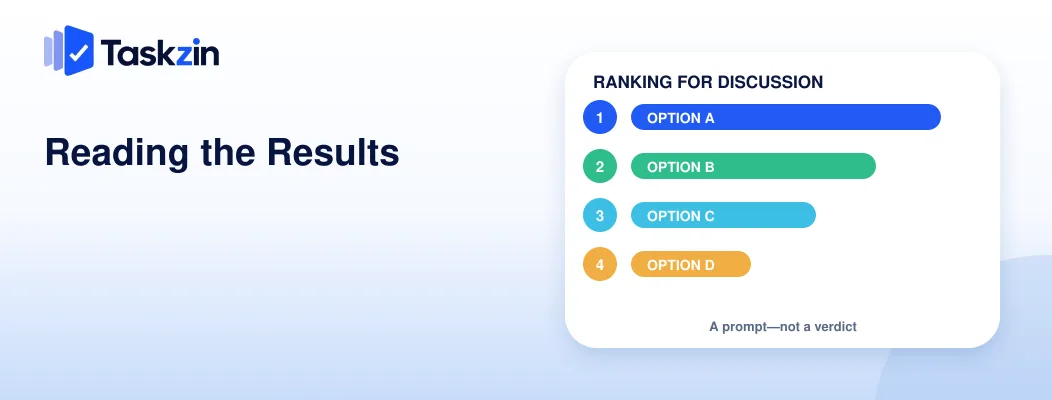
A RICE ranking is a structured prompt for discussion. Where it disagrees with judgement, the disagreement itself is the valuable output.
The ranking is a prompt, not a verdict
The score compresses four uncertain estimates into one number. That number is a starting point for a conversation, not the conclusion of one.
Teams that treat the output as binding end up building whatever scored highest, including things everyone privately knew were wrong.
Where the score misleads
High-reach, low-impact items score well — dark mode outranking a feature three times as impactful, as in the example above. Small, cheap items also score well simply because the denominator is small.
RICE systematically favours incremental improvement over meaningful change, which is fine if you know it and problematic if you do not.
What to do when the result feels wrong
Do not adjust the numbers until the ranking matches your intuition. Instead, identify which input you disagree with and why.
Usually you will find either an assumption worth testing or a factor the framework does not capture — strategic importance, a dependency, a competitive threat. Both are useful discoveries, and both are more valuable than the score itself.
When RICE Works and When It Does Not
RICE works well for comparing many similar, incremental items; it works poorly for strategic bets and for anything where reach cannot be estimated meaningfully.
Good for comparing similar items
A backlog of feature requests of broadly similar type is exactly what RICE is for. It provides a consistent basis for comparison and surfaces disagreement about assumptions.
Poor for strategic bets
A new product line, entering a new market, or a platform rebuild cannot be scored honestly.
Reach is unknown, impact is speculative, and effort estimates at that scale are unreliable.
Forcing a strategic decision through RICE produces a low score for everything ambitious, because uncertainty is penalised twice — once through confidence and again through inflated effort.
Poor when reach is unmeasurable
Internal tooling, technical debt, compliance work and infrastructure often have no meaningful reach figure.
Either exclude these from RICE and allocate capacity to them separately, or accept that the framework will systematically underrate them.
Common RICE Mistakes Three errors undermine RICE: inventing precision, leaving confidence at 100 percent, and scoring the entire backlog.
Inventing precision you do not have
A score of 4,800 looks precise. It is the product of four estimates, two of which may be guesses.
Treat scores as bands rather than exact values. Items scoring 4,800 and 4,600 are effectively tied, and arguing about the difference is arguing about rounding error.
Letting confidence stay at 100 percent
If every item is scored at full confidence, the factor does nothing and RICE degenerates into ICE with extra steps.
Confidence is the framework's honesty mechanism. Using it properly is what distinguishes RICE from a wishful ranking.
Scoring the entire backlog
Scoring two hundred items takes days and mostly confirms what was already obvious.
Score the contested ones — the fifteen or twenty items where reasonable people disagree about order. That is where the framework earns its time.
Frequently asked
What is the RICE scoring framework?
A prioritisation method scoring each item on Reach, Impact, Confidence and Effort, then ranking by (Reach × Impact × Confidence) ÷ Effort to compare items on a consistent basis.
What is the RICE formula?
RICE score = (Reach × Impact × Confidence) ÷ Effort. Reach is people affected per period, Impact is on a fixed scale, Confidence is a percentage, and Effort is total person-months.
How do you measure reach in RICE?
Count people or events affected within a fixed period, using analytics where available. Where you have no data, use the best proxy and lower confidence rather than inventing a precise figure.
What impact scale should you use?
A fixed scale with written definitions — commonly 3 for massive, 2 for high, 1 for medium, 0.5 for low and 0.25 for minimal. The definitions matter more than the specific numbers.
What does the confidence factor do?
It discounts the score according to how well evidenced your reach and impact estimates are. It is the framework's mechanism for distinguishing researched estimates from educated guesses.
When should you not use RICE?
For strategic bets where reach and impact cannot be estimated honestly, and for internal or compliance work with no meaningful reach figure. Both get systematically underrated.
Is RICE better than MoSCoW?
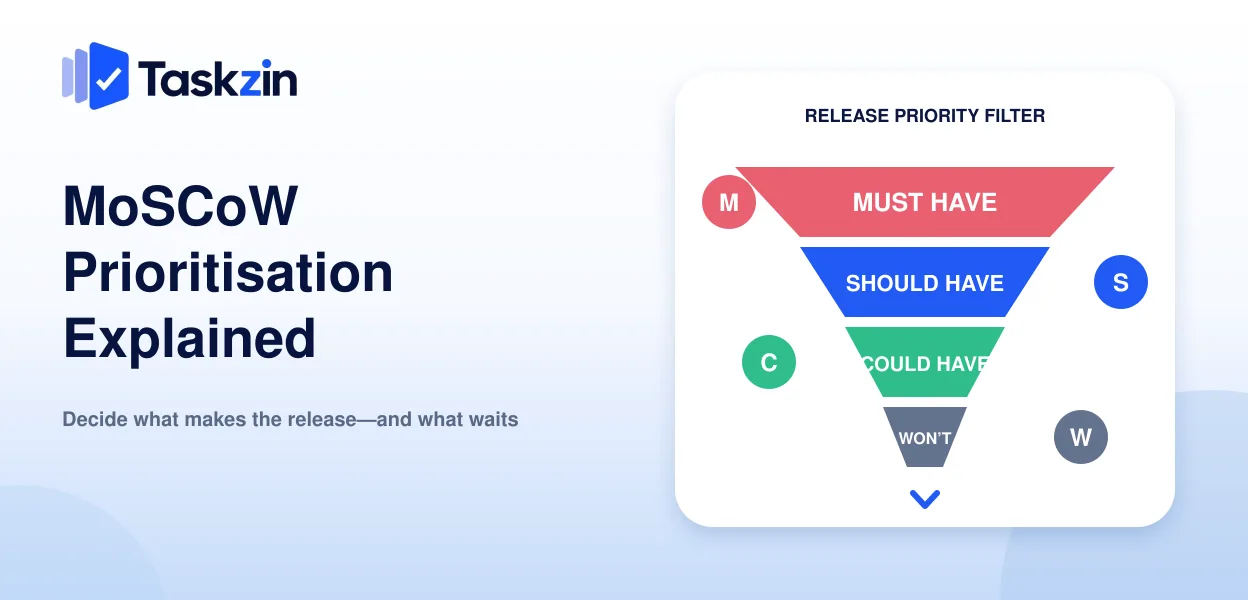
They solve different problems. RICE ranks a long backlog by expected value; MoSCoW scopes a fixed-date release with stakeholders. Many teams use both, for different conversations.
Sanju Shrestha is a SaaS content writer at Taskzin who explores smarter ways to manage work, organize priorities, and improve team performance. Her content covers productivity strategies, digital workflows, collaboration, and task management, with a focus on helping modern teams work more efficiently and stay aligned.
All posts by Sanju Shrestha

Comments