What Is a Gantt Chart and When Should You Use One?
A plain-English explanation of Gantt charts, covering what the chart shows, how dependencies and lag work, how it compares to other views, how to build one properly, and when to use a Gantt chart versus when to avoid it.

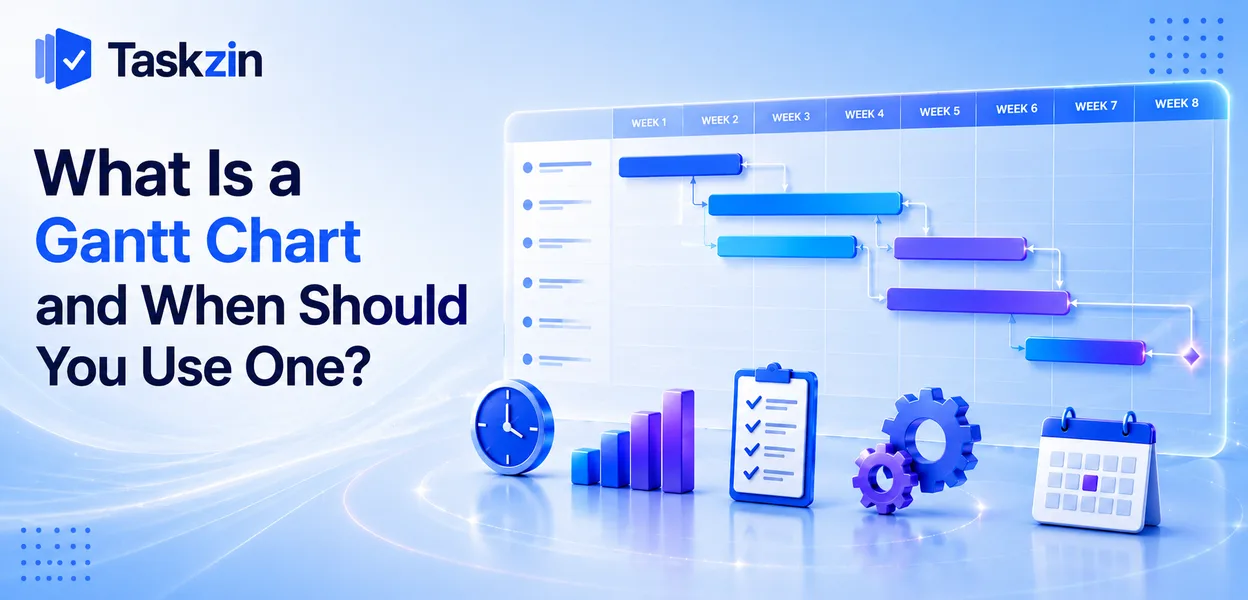
The Gantt chart is over a century old and still the standard way to show a project across time. It is also widely misused — drawn once before a project starts, admired, and never opened again.
Understanding what it is genuinely good at, and what it is not, determines whether it becomes a working tool or an expensive picture of an early assumption.
This guide explains what a Gantt chart shows, how dependencies work, how to build one, and when a different view would serve you better.
Quick answer: Quick answer: A Gantt chart is a bar chart showing project tasks across a timeline, where each bar's position and length represent when a task starts and how long it takes. Lines between bars show dependencies — which tasks must finish before others can start. Its real purpose is managing those dependencies, so that when one task slips you can see immediately what else moves.
What a Gantt Chart Shows
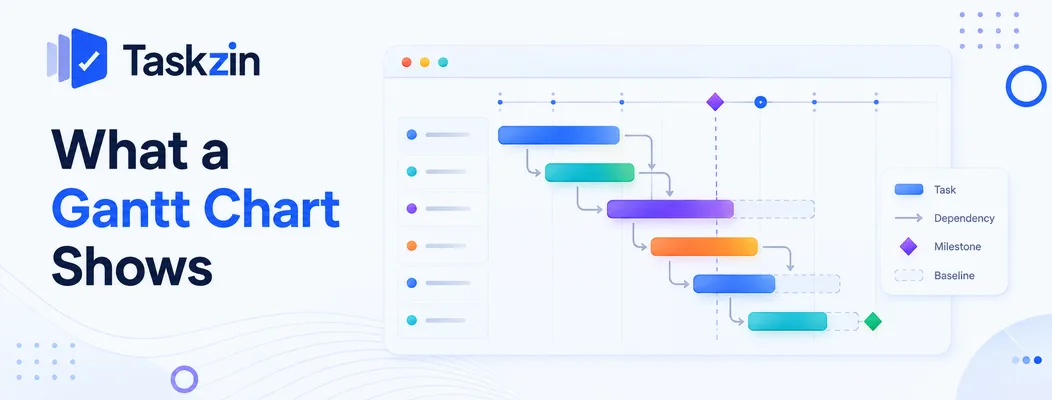
A Gantt chart displays tasks as horizontal bars along a time axis, with links showing dependencies, diamonds marking milestones, and optionally a baseline recording the original agreed plan.
Bars, dates and the timeline
Each task is a bar. Where it sits horizontally shows when it happens; its length shows how long it takes. Time runs left to right along the top.
That is the whole visual grammar, and it is why the format has lasted — someone with no training can read a Gantt chart in a few seconds.
Dependencies between tasks
Lines connecting bars indicate that one task must happen before another. This is the part that distinguishes a real Gantt chart from a timeline drawn in a slide deck.
With dependencies in place, moving one task automatically moves everything downstream.
Without them you have a picture that has to be redrawn by hand every time reality changes, which is why so many Gantt charts are abandoned in week three.
Milestones and the baseline
Milestones are zero-duration markers for significant points — approval received, phase complete, launch. They are the events stakeholders care about.
A baseline saves the originally agreed schedule so you can compare it against what actually happened. Without one, the plan silently rewrites itself as dates slip, and by month three nobody can demonstrate what was agreed at the start.
How Dependencies Actually Work
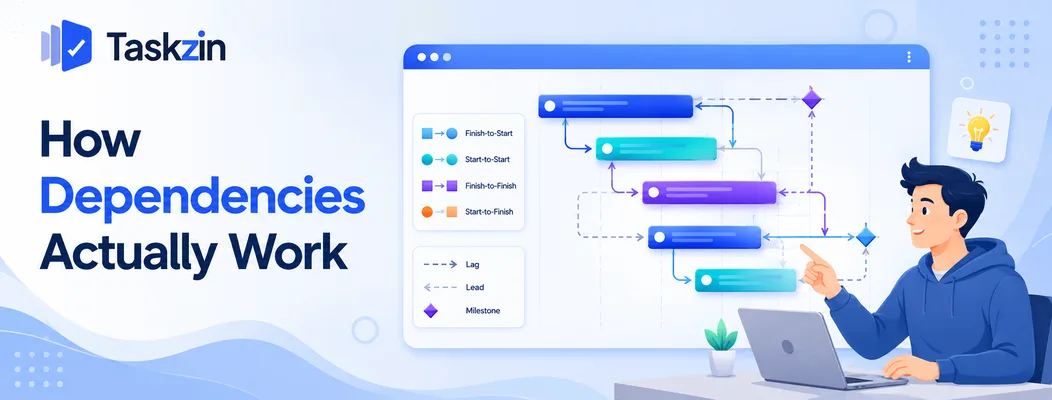
Dependencies come in four types with optional lag, and modelling them accurately is what makes the chart able to answer "what moves if this slips?"
The four relationship types
Finish-to-start is the common one: B starts when A finishes. Start-to-start means B can begin once A has begun. Finish-to-finish means B cannot complete until A does. Start-to-finish is rare and mostly appears in shift handovers.
Most tools support all four. Most projects use finish-to-start for the large majority of links, with start-to-start for genuinely parallel work.
Lag and lead time
Lag is enforced waiting between linked tasks. Paint cannot start until three days after plaster finishes, because plaster has to dry.
Lag matters because it cannot be compressed by adding people. Modelling it explicitly is what stops a schedule promising something physically impossible. Lead time is the reverse — allowing a task to start before its predecessor fully completes.
Why false dependencies cause problems
Teams routinely link tasks that merely happen in a customary order rather than tasks that genuinely constrain each other.
The effect is a schedule more rigid than reality. Work that could run in parallel appears sequential, the timeline looks longer than it needs to be, and the critical path identifies the wrong tasks as urgent. Only link what is genuinely constrained.
Gantt Chart Versus Other Views
View Shows Best for Weakness Gantt chart Tasks over time with
Add dependencies before dates
Sequenced work, fixed end dates Heavy to maintain Kanban board Current stage of each item Continuous flow No timeline List Tasks with owners and dates Simple independent work No sequence
Continuous work with no end
Timeline / roadmap High-level phases Stakeholder communication Too coarse to manage by Burndown chart Remaining work over time Sprint progress One iteration only
How to Build One

Decompose the work, link genuine dependencies before assigning dates, let the tool identify the critical path, then baseline the agreed plan.
Break the work down first
Start with the deliverables and decompose until each item is small enough to estimate with some confidence — usually a few days rather than several weeks.
Scheduling before decomposing produces bars representing vague intentions. A task called "development, six weeks" cannot tell you whether week four is on track, which means the chart cannot warn you about anything.
Add dependencies before dates Link the tasks that genuinely constrain each other, then let the dates emerge from the durations and the sequence.
Working the other way round — assigning desired dates and adding links afterwards — produces a chart that shows what you hoped rather than what the work requires.
Identify the critical path
Once linked, the software calculates the longest chain of dependent tasks. Any delay on that chain moves the end date directly.
This is the single most useful output. It tells you which handful of tasks deserve daily attention, and equally which tasks have slack and can absorb a delay without consequence.
Baseline it
Save the agreed plan. From then on, record actual progress against it so variance is visible weekly rather than discovered at the end.
When to Use a Gantt Chart
A Gantt chart earns its maintenance cost when task order genuinely constrains delivery, when there is a fixed end date, or when someone outside the team needs to understand the plan.
Work where sequence genuinely constrains delivery
Construction, events, product launches, migrations, regulated programmes. In each, some things simply cannot start until others finish.
If your work is a set of independent items with deadlines, a list or a calendar does the job with far less effort.
Projects with a fixed end date
When the finish is immovable, you need to know what must start when. Backwards scheduling from a fixed date is exactly what a Gantt chart supports.
When you need to show a plan to someone outside the team
Clients, boards and funders read Gantt charts without training. For communicating a plan to people who will not learn your tooling, it remains the clearest format available.
When Not to Use One
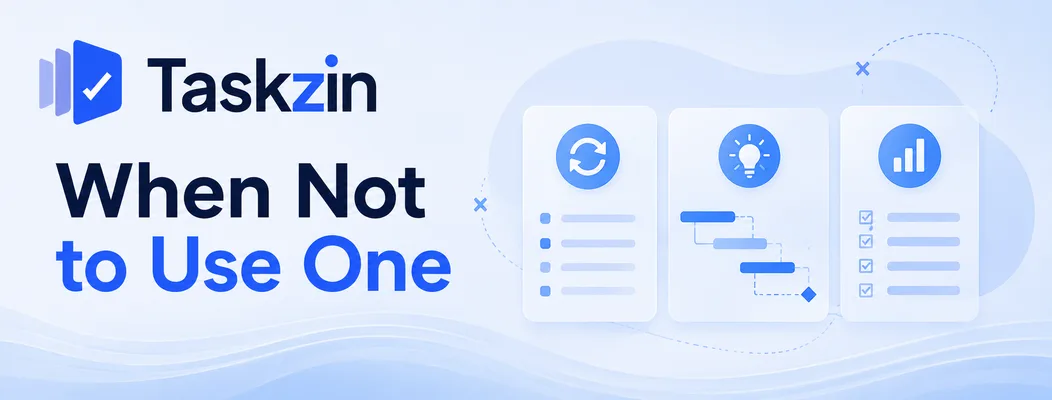
Gantt charts are counterproductive for continuous work, genuinely exploratory work, and small projects where maintenance costs more than it returns.
Continuous work with no end Support queues, ongoing content, maintenance. There is no end date, so there is no timeline.
Forcing one produces bars that get dragged forward every week until everyone ignores the chart.
Genuinely exploratory work
Research and early-stage product discovery cannot be sequenced in advance without inventing certainty that does not exist. A Gantt chart here documents a fiction.
Small projects
A three-week piece of work with five tasks does not need dependency modelling. The overhead of building and maintaining the chart exceeds anything it tells you.
Frequently asked
What is a Gantt chart?
A bar chart showing project tasks along a timeline, where each bar's position and length indicate when a task happens and how long it takes, with links between bars showing dependencies.
What is a Gantt chart used for?
Managing dependencies and sequence. It shows what must finish before something else can start, identifies the critical path, and reveals what moves when a task slips.
Who invented the Gantt chart?
It is named after Henry Gantt, who popularised the format in the 1910s, though earlier versions of the same idea had appeared previously.
What are the four types of task dependency?
Finish-to-start, start-to-start, finish-to-finish and start-to-finish. Finish-to-start covers most cases; the others handle parallel and overlapping work.
What is a baseline on a Gantt chart?
A saved copy of the originally agreed schedule, used to compare planned dates against actual progress. Without one, the schedule quietly rewrites itself as dates change.
Can you make a Gantt chart in Excel?
Yes, using a stacked bar chart or conditional formatting. It works for a static picture but has no automatic dependency recalculation or critical path, so it ages badly once dates move.
When should you not use a Gantt chart?
For continuous work with no end date, for exploratory work that cannot honestly be sequenced, and for small projects where maintaining the chart costs more than it reveals.
Sujan Sharma is a content writer at Taskzin with a strong focus on productivity systems, task management, workflow optimization, team collaboration, and SaaS technology. He creates research-driven, practical content that helps professionals and growing teams improve operational efficiency, streamline processes, and make informed decisions about modern work management tools.
All posts by Sujan Sharma
Comments