Team Productivity Metrics That Actually Mean Something
A guide to team productivity metrics, covering why most fail, the four that describe delivery honestly and resist gaming, the metrics to avoid, how to collect data safely, and common measurement mistakes.

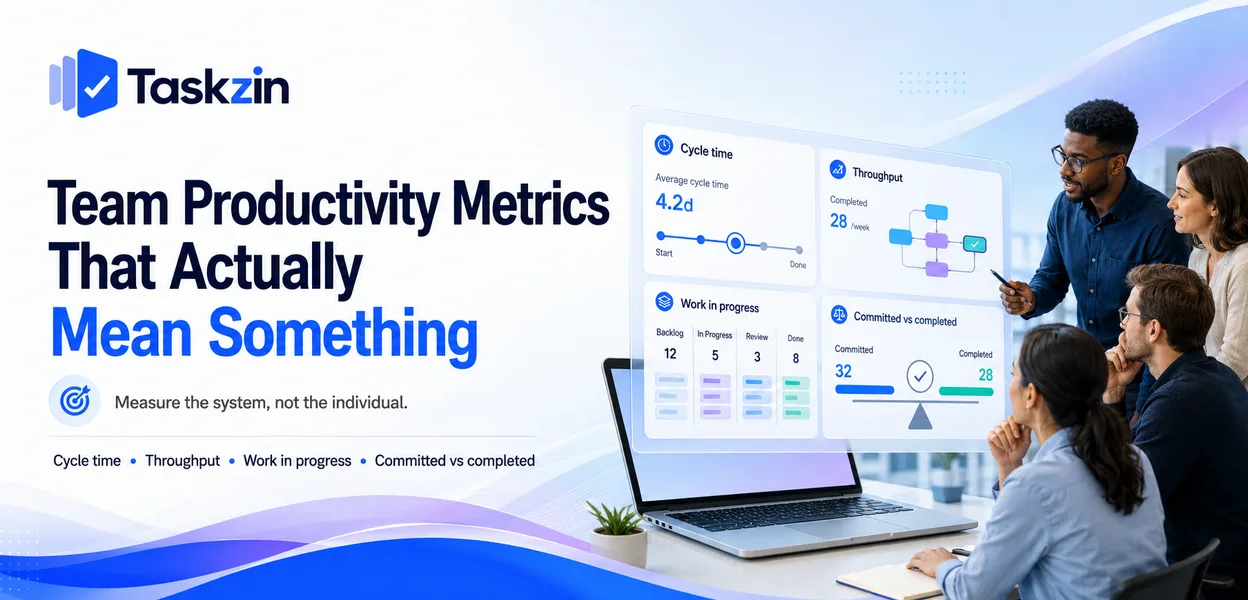
The underlying principle is Goodhart's law — when a measure becomes a target, it stops being a good measure. Almost every failed productivity metric is an example of it.
This guide covers why most metrics fail, the four that work, what to avoid, and how to collect data without damaging trust.
Quick answer: The four metrics worth tracking are cycle time, throughput, work in progress and committed versus completed. All four describe the system rather than individuals, none requires estimation, and none can be improved by simply working faster. Hours logged, tasks closed per person and velocity used as a target all fail for the same reason: they measure activity and can be adjusted by the people being measured.
Why Most Productivity Metrics Fail
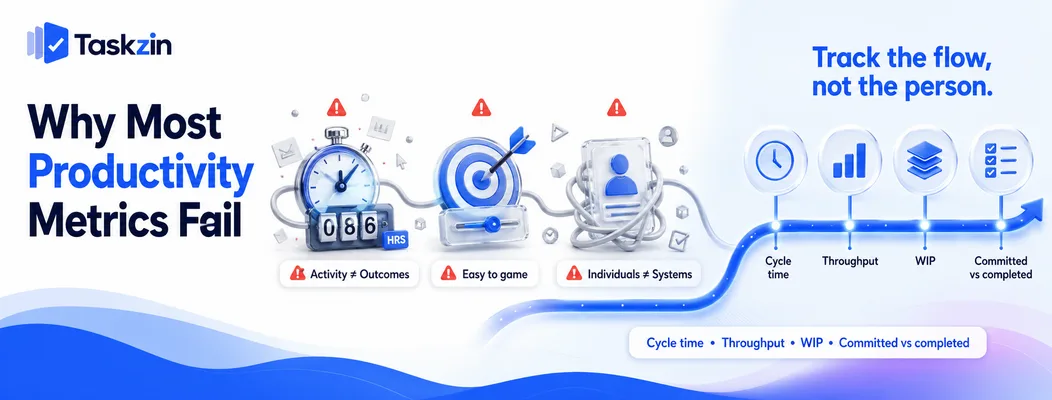
Common productivity metrics fail because they measure activity rather than
They can be gamed by the people measured
attribute system behaviour to individuals.
They measure activity, not outcomes
Hours worked, messages sent, tickets closed, commits made. All are easy to count and weakly related to value delivered.
The problem is not that activity is irrelevant — it is that the relationship between activity and value is loose enough that optimising activity does not improve value. A team measured on tickets closed will close more tickets, by splitting work into smaller tickets.
They can be gamed by the people measured Any metric whose inputs are controlled by the person being assessed will drift. Story point estimates inflate when velocity becomes a target. Task counts rise when task counts are rewarded.
This is not dishonesty. It is a rational response to being measured on something you control, and it happens reliably enough to be treated as a design constraint rather than a people problem.
They describe individuals rather than the system
Most delivery problems are systemic — waiting for review, unclear requirements, too much work in progress, dependencies on one person.
Measuring individuals against a systemic problem produces the wrong conclusion and the wrong response. If work waits four days for review, that is a process constraint, and no amount of individual encouragement addresses it.
Metrics Worth Tracking, and What Each Tells You
Metric What it measures Gameable? Tells you Cycle time Start to done, elapsed Hard How long work actually takes
Throughput
Items completed per period Moderate Delivery rate, forecasting base
Work in progress
Items open simultaneously Hard Whether you start more than you finish Committed vs
Committed versus completed
Reliability of commitments Hard Whether planning is realistic Flow efficiency Active time vs elapsed
Cycle time
Hard How much time is waiting Deployment frequency Release cadence Moderate Delivery pipeline health Change failure rate Releases needing remediation Moderate Quality of the pipeline Hours logged Time recorded Very easy Almost nothing useful
Tasks closed per person
person Individual count Very easy Task-splitting behaviour
The Four Metrics That Earn Their Place

Cycle time, throughput, work in progress and commitment reliability describe delivery honestly, require no estimation, and resist gaming.
Cycle time Elapsed time from work starting to being done. This is what a customer or stakeholder actually experiences.
Look at the distribution rather than the average. If most items finish in three days and some take three weeks, the long tail is where your process breaks — and investigating those specific cases produces more improvement than any change aimed at the median.
Throughput Items completed per week or per sprint. It requires no estimation, which is its main advantage over velocity.
After eight to ten periods of history, throughput supports genuine forecasting: "we complete six to nine items a week, so thirty items takes four to five weeks". That is a defensible forecast produced without a single estimation meeting.
Work in progress How many items are open simultaneously, per team and per person.
This is the most useful early-warning metric available. Rising WIP with flat throughput means the team is starting more than it finishes, which lengthens cycle time for everything — and it shows up well before anyone notices delivery slowing.
Committed versus completed
What the team planned to deliver against what it actually delivered.
Persistent shortfall means the commitment is too large, not that the team is slow. This metric protects the team, because it moves the conversation from individual performance to planning realism — which is where the actual problem usually is.
Metrics to Avoid
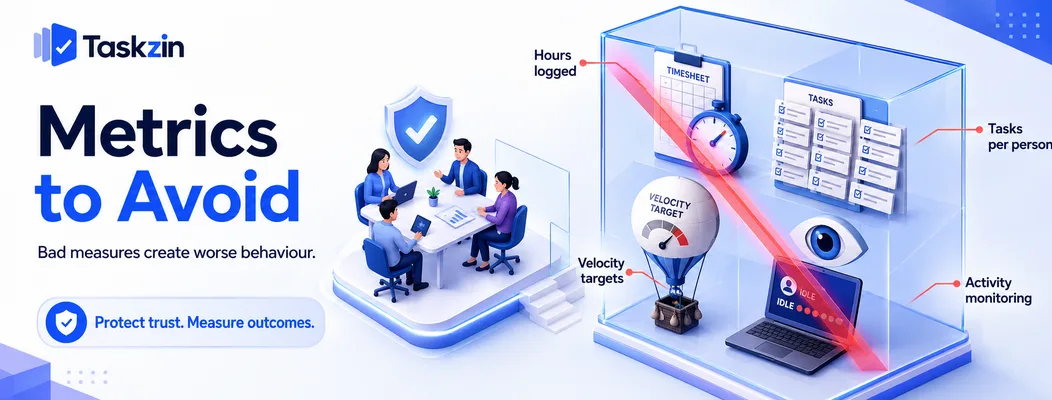
Hours logged, per-person task counts, velocity used as a target, and activity monitoring all produce worse behaviour than no measurement at all.
Hours logged
Time recorded for costing and capacity planning is legitimate. Time used to assess individuals is not.
It penalises exactly the behaviour you want: the person who finds a two-hour route to something that would have taken eight looks less productive than the colleague who took the long way.
Tasks closed per person Rewards splitting work into smaller pieces and penalises taking on difficult items.
It also penalises the person who spends a day unblocking three colleagues, which is frequently the most valuable thing anyone did that week.
Velocity as a performance measure
Story points are estimated by the team. Asking them to increase points delivered produces larger estimates within two sprints.
Velocity is a forecasting aid for one team over time and nothing else. Used for evaluation, it corrupts and takes the team's honesty about estimates with it.
Activity and presence monitoring
Screenshots, idle-time tracking, online status. These measure presence and reliably damage trust while producing no decision you could not make better from the work itself.
Making Metrics Safe to Collect
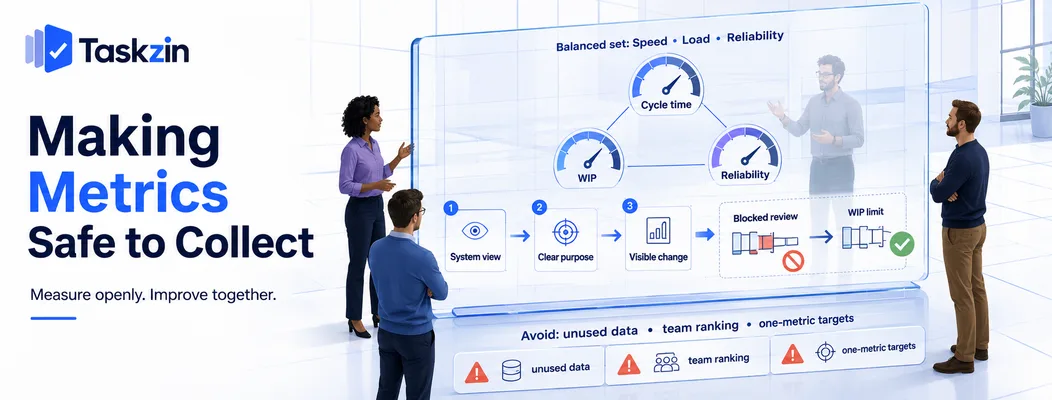
Measure at system level, state explicitly what the data is for, and show the team what changed as a result of it.
Measure the system, not the individual
Team-level cycle time, throughput and WIP tell you about the process. The same figures per individual invite comparison that the data cannot support, because individuals work on different types of work.
The one legitimate per-person view is work in progress, used to spot overload rather than to assess output.
Say what the data is for
Teams read the purpose of measurement from behaviour, so state it and then behave consistently.
If the stated purpose is improving planning and the data appears in a performance conversation once, honest reporting ends permanently. That trade is never worth it.
Show the team what changed
Present what the metrics revealed and what was done about it: the review bottleneck you fixed, the WIP limit you set, the commitment you reduced.
When people see measurement producing decisions that improve their working life, they participate. When it disappears into a management dashboard, they comply minimally.
Tools that make these figures visible to the whole team rather than to managers only — Taskzin's dashboards are visible to members, not just admins — make this easier by default.
Common Measurement Mistakes
The three failures are collecting data nobody acts on, comparing teams using locally calibrated scales, and optimising one metric in isolation.
Collecting data nobody acts on
Teams frequently track diligently for months and never analyse the results. The measurement becomes pure overhead, and people stop maintaining it once they notice.
Name in advance the decision the data will inform. If you cannot, do not collect it.
Comparing teams on local scales
Story points are calibrated within a team, so cross-team velocity comparison is arithmetic without meaning.
If you need to compare, use throughput or cycle time, which do not depend on a local scale. Even then, differences in work type make comparison less informative than it appears.
Optimising a single metric
Push cycle time down alone and quality suffers. Push throughput up alone and items get smaller without more value delivered.
Track a small balanced set — a speed measure, a load measure and a reliability measure — so improvement in one is visible against the others. Any single metric optimised in isolation will eventually be optimised at something else's expense.
Frequently asked
What are the best team productivity metrics?
Cycle time, throughput, work in progress and committed versus completed. All four describe the system rather than individuals, need no estimation, and resist gaming.
Why is measuring hours a bad metric?
Because hours are weakly related to value and easy to inflate. It also penalises efficiency — someone who finds a faster route looks less productive than someone who took longer.
Should you measure individual productivity?
Individual activity metrics reliably backfire. The one useful per-person figure is work in progress, used to spot overload rather than to assess output. Assess individuals through outcomes and quality instead.
What is cycle time and why does it matter?
Elapsed time from work starting to being done. It matters because it is what stakeholders experience, it requires no estimation, and it cannot be improved by adjusting how you count things.
Can you compare productivity between teams?
Poorly. Story points are locally calibrated so velocity comparison is meaningless. Throughput and cycle time are comparable in principle, but differences in work type limit how much the comparison tells you.
How often should you review productivity metrics?
Monthly for trends, and at each retrospective for the team's own use. Reviewing more often introduces noise; less often means problems are found after they have compounded.
How do you measure productivity on a remote team?
The same way as any team — cycle time, throughput, WIP and commitment reliability. Remote work changes visibility, not what should be measured. Activity monitoring is the wrong response to reduced visibility.
Sanju Shrestha is a SaaS content writer at Taskzin who explores smarter ways to manage work, organize priorities, and improve team performance. Her content covers productivity strategies, digital workflows, collaboration, and task management, with a focus on helping modern teams work more efficiently and stay aligned.
All posts by Sanju Shrestha

Comments