Best Gantt Chart Software
A comparison of the best Gantt chart software, covering what Gantt charts are genuinely for, ten tools reviewed on dependencies and critical path, a practical build guide, and when a timeline is the wrong tool.

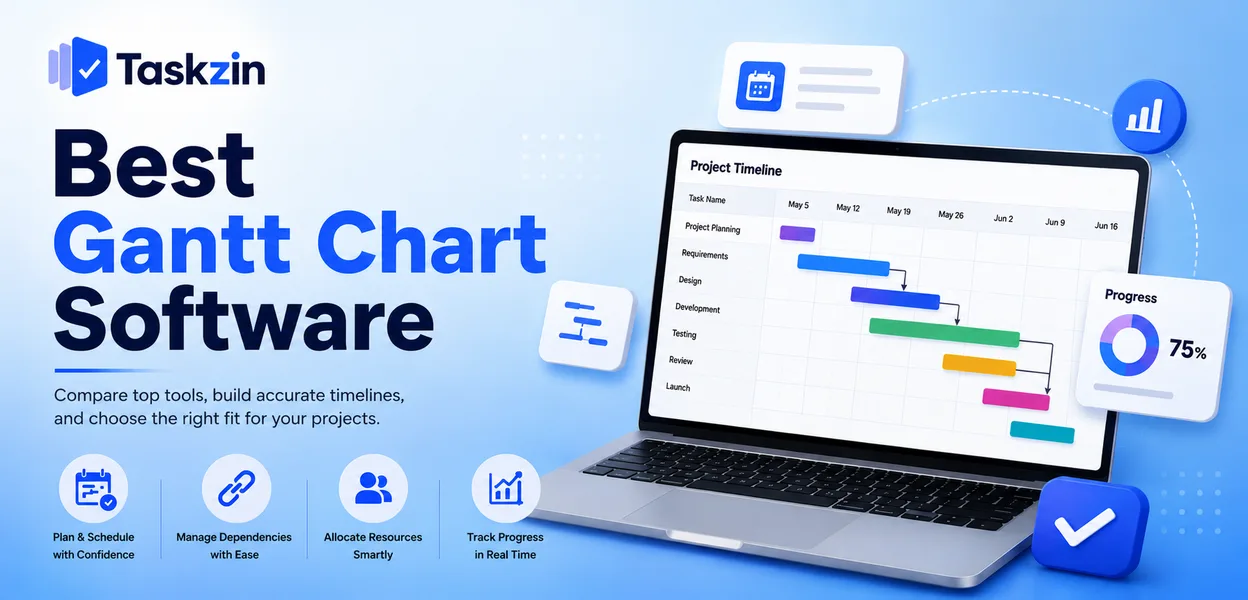
A Gantt chart is one of the oldest project tools still in use, and one of the most misused. Teams adopt it because it looks like project management, build a beautiful timeline before kickoff, and never open it again — at which point it is an expensive picture of what someone hoped would happen.
This guide covers what a Gantt chart is genuinely good at, ten tools compared, how to build one that stays accurate, and when a different approach is better.
Quick answer: The best Gantt chart software depends on how much scheduling rigour you need: Taskzin, Asana and Monday.com suit teams that mainly want a visual timeline, while Microsoft Project, Smartsheet and Wrike handle dependencies, critical path and resource loading for genuinely complex delivery. The dividing question is whether your tasks depend on each other in ways you must actively manage.
What a Gantt Chart Is Actually For
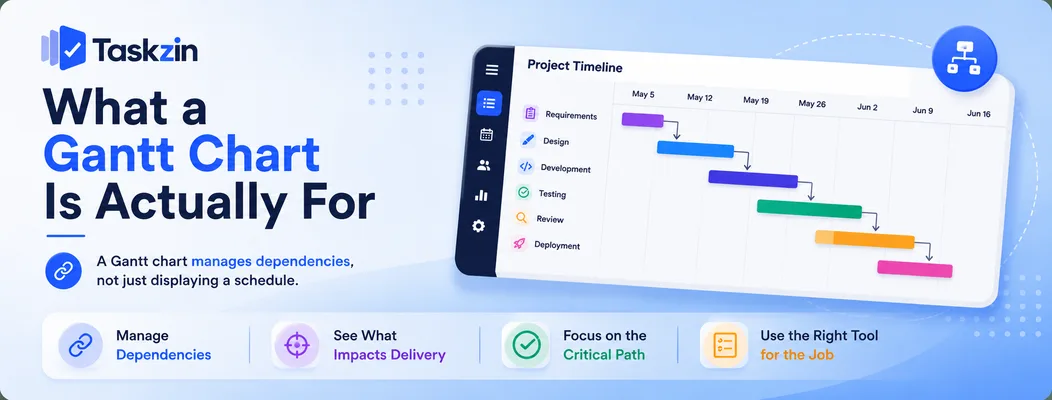
A Gantt chart shows tasks as horizontal bars across a timeline, with links between them showing which tasks must finish before others can start — its real purpose is managing dependencies, not displaying a schedule.
If your work is a set of independent items with deadlines, a calendar or list does the job with less effort. The chart earns its cost when the order of work genuinely constrains delivery.
Dependencies, not decoration
The moment a Gantt chart becomes indispensable is when you need to answer: if this task slips by four days, what else moves?
Software with real dependency support answers that automatically. Everything downstream shifts, the critical path recalculates, and you can see immediately whether the end date is affected or absorbed by slack. A chart drawn in a slide deck cannot do this, which is why static timelines age badly the first time something changes.
When a Gantt chart is the wrong tool
Three situations make a Gantt chart counterproductive. Continuous work with no defined end — support queues, ongoing content, maintenance — has no meaningful timeline. Genuinely
exploratory work cannot be sequenced in advance without inventing certainty that does not exist. And very small projects rarely justify the maintenance.
For those, a Kanban board or a simple task list will serve better, and be updated far more honestly.
Best Gantt Chart Software at a Glance
Tool Best for Dependencies Critical path Free plan Taskzin Teams without a dedicated PM Yes Yes Yes
Microsoft Project — best for formal project management
Smartsheet Spreadsheet-style planning Yes Yes Limited TeamGantt Dedicated Gantt work Yes Yes Limited Wrike Resource-loaded timelines Yes Yes No (on paid tiers) ClickUp All-in-one platforms Yes Yes Limited
Monday.com — best visual timeline
Asana Lightweight timeline Yes No No (paid feature) GanttPRO Simple paid Gantt Yes Yes No ProjectLibre Free desktop alternative Full Yes Yes
The Best Gantt Chart Tools Reviewed
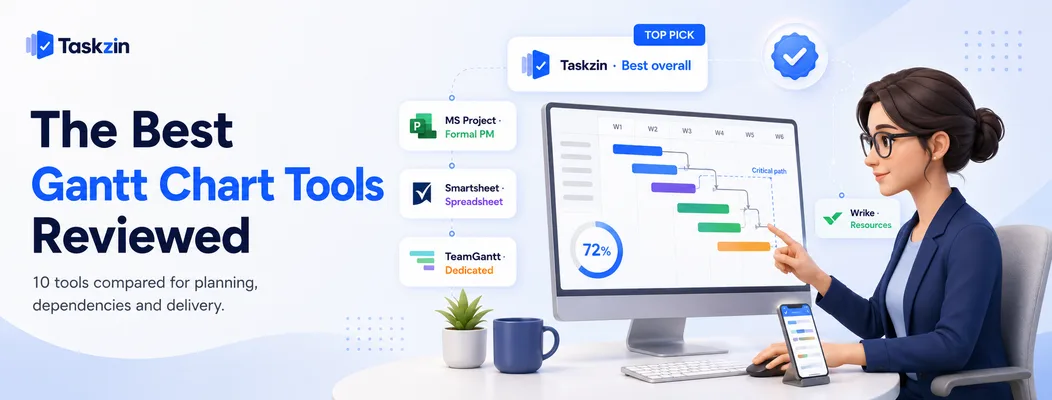
Taskzin — best Gantt for teams without a project manager
Taskzin's timeline supports dependencies and critical path without requiring formal scheduling training, so a team lead can build a workable plan in an afternoon rather than a week.
Best for: small and mid-sized teams delivering client or product work on deadlines.
Trade-off: it does not attempt the depth of a dedicated scheduling package for large capital projects.
Microsoft Project — best for formal project management Project remains the most complete scheduling tool available, with full dependency types, resource levelling, baselines and earned value analysis.
Best for: trained project managers running large, formally governed programmes.
Trade-off: a steep learning curve and a cost that is difficult to justify below a certain project scale.
Smartsheet — best spreadsheet-style Gantt
Smartsheet presents scheduling in a familiar grid with a Gantt view attached, which lowers resistance considerably for teams that already plan in spreadsheets.
Best for: organisations migrating from Excel-based schedules.
Trade-off: it inherits some spreadsheet awkwardness, and advanced features sit on higher tiers.
TeamGantt — best dedicated Gantt tool
TeamGantt does one thing and does it cleanly, with drag-and-drop scheduling that is noticeably easier than most general project tools.
Best for: teams whose primary need genuinely is the chart itself.
Trade-off: less useful as an everyday task tool for the people doing the work.
Wrike — best for resource-loaded timelines
Wrike combines Gantt scheduling with workload views, showing not just when work is scheduled but whether the assigned people actually have capacity.
Best for: agencies and services teams juggling people across concurrent projects.
Trade-off: Gantt features sit on paid tiers and setup takes real effort.
ClickUp — best Gantt inside an all-in-one tool
ClickUp's Gantt view sits alongside boards, lists and docs, letting the same work be viewed several ways without duplication.
Best for: teams consolidating tools who need a timeline occasionally.
Trade-off: less refined than dedicated scheduling software for complex dependency networks.
Asana — best lightweight timeline view
Monday.com's timeline is the most visually approachable in this list, which matters when stakeholders who do not use the tool daily need to read it.
Best for: client-facing timelines and internal communication.
Trade-off: dependency and critical path handling is lighter than the specialist options.
Asana — best lightweight timeline view Asana's Timeline is a straightforward way to see project work laid out over time with basic dependency support.
Best for: teams already in Asana who want scheduling without a second tool.
Trade-off: no critical path calculation, and Timeline requires a paid plan.
GanttPRO — best simple paid option
GanttPRO offers a focused, well-priced Gantt experience with dependencies, baselines and basic resource management.
Best for: small teams wanting proper scheduling without enterprise pricing.
Trade-off: a smaller integration ecosystem than the major platforms.
ProjectLibre and open-source options
ProjectLibre is a free desktop application that reads Microsoft Project files and covers most core scheduling functions.
Best for: individuals and organisations needing Project-style scheduling at no licence cost.
Trade-off: dated interface and limited collaboration — this is a desktop tool, not a shared workspace.
How to Build a Gantt Chart That Survives Contact With Reality
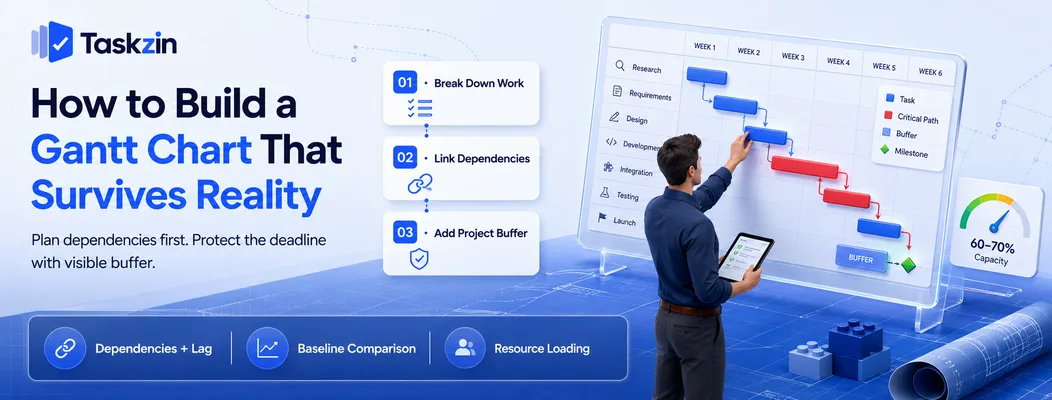
Build a Gantt chart by decomposing the work first, adding dependencies before dates, identifying the critical path, and placing buffer at the project level rather than padding every task.
Step 1: Break work down before you schedule anything
Start with a work breakdown structure — the full set of deliverables, decomposed until each item is small enough to estimate with some confidence, usually a few days rather than a few weeks.
Scheduling before decomposing produces bars representing vague intentions. A task called "development, six weeks" tells you nothing about whether week four is on track, which means the chart cannot warn you about anything.
Step 2: Add dependencies, then find the critical path
Link the tasks that genuinely constrain each other. Resist linking tasks that merely happen in a customary order — false dependencies make the schedule more rigid than reality and produce fake urgency.
Once linked, the software identifies the critical path: the longest chain of dependent tasks, where any delay directly moves the end date. This is the most useful output of the entire exercise, because it tells you exactly which few tasks deserve close attention.
Step 3: Build in buffer where it belongs
Padding every individual task hides your real contingency and guarantees the padding gets consumed, since work expands to fill the time allotted.
Estimate tasks honestly, then hold a single visible buffer before the delivery milestone. You then know exactly how much protection remains and can watch it deplete, which is information a padded schedule never gives you.
Gantt Chart Features That Actually Matter
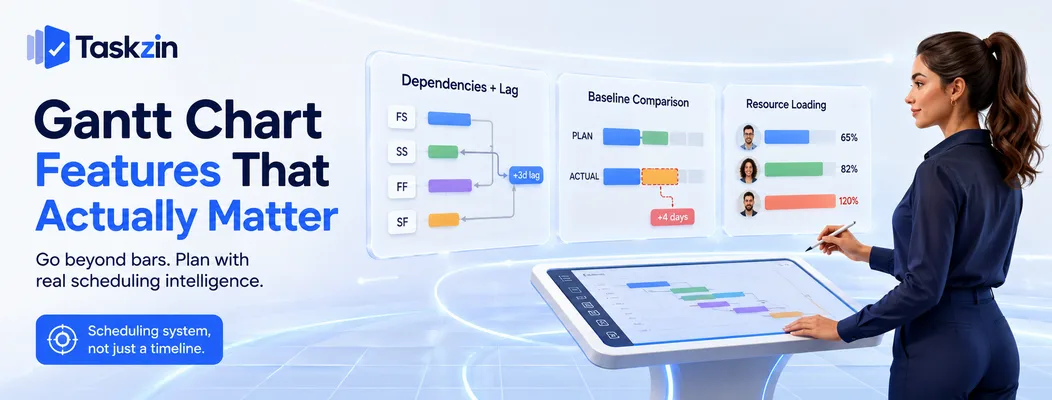
Beyond drawing bars, the features that change outcomes are full dependency types with lag, baseline comparison, and resource loading — a tool missing these is a timeline viewer rather than a scheduling system.
Dependency types and lag
Most work is finish-to-start: B begins when A ends. Real projects also need start-to-start, finish-to-finish and, occasionally, start-to-finish relationships.
Lag matters just as much. "Paint begins three days after plaster finishes" models drying time that no amount of extra staffing can compress. Software supporting only simple links forces you to fake these with dummy tasks.
Baselines
A baseline saves the approved plan so you can compare it against actual progress later.
Without one, a schedule silently rewrites itself as dates slip, and by month three nobody can say whether you are behind.
This is the feature that turns a Gantt chart from a plan into an accountability record.
Resource loading
Resource loading shows whether the people assigned to overlapping tasks actually have the hours. Charts that ignore capacity routinely schedule one person onto three simultaneous full-time tasks and call it a plan.
Common Gantt Chart Mistakes
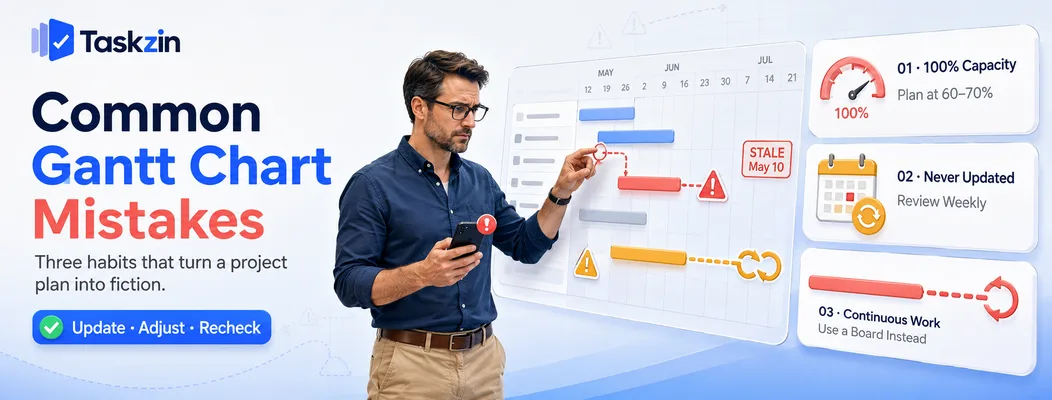
The three failures that make Gantt charts useless are scheduling everyone to full capacity, never updating after kickoff, and applying the chart to continuous work.
Scheduling to 100 percent capacity
Nobody delivers eight productive hours a day on project work. Meetings, support, admin and context switching consume a substantial share. Planning at roughly 60 to 70 percent of nominal capacity produces schedules that survive normal weeks.
Never updating after kickoff
A Gantt chart is a model, and a model not fed actuals becomes fiction within weeks. A short weekly pass — mark real progress, shift what moved, look at the new critical path — keeps it worth consulting.
Using a Gantt chart for continuous work
Ongoing work with no end date does not have a timeline. Forcing it into one produces bars that get dragged forward every week, which teaches everyone that the chart means nothing.
Frequently asked
What is the best Gantt chart software?
Microsoft Project and Smartsheet lead for formal, complex scheduling. Taskzin, Monday.com and Asana suit teams wanting a workable timeline without specialist training. TeamGantt is the strongest dedicated option.
What is a Gantt chart used for?
Showing project tasks as bars across a timeline, with links indicating which tasks depend on others, so you can see the sequence, the critical path, and what moves when something slips.
What is the best free Gantt chart software?
ProjectLibre is a free desktop tool with full scheduling features. Taskzin, ClickUp and Monday.com include timeline views on free or entry tiers with some limitations.
Can Excel make a Gantt chart?
Yes, using a stacked bar chart or conditional formatting. It works for a simple static timeline but has no automatic dependency recalculation or critical path, so it ages badly once dates change.
What is the critical path on a Gantt chart?
The longest chain of dependent tasks through the project. Any delay to a task on the critical path pushes the completion date directly, so these are the tasks that need the closest management.
What are the four dependency types?
Finish-to-start, start-to-start, finish-to-finish and start-to-finish. Finish-to-start covers most cases; the others handle overlapping and parallel work that simple links cannot model.
Is Microsoft Project still worth using?
For trained project managers on large, formally governed projects, yes — its scheduling depth is unmatched. For small teams, the learning curve and cost usually outweigh the benefit.
When should you not use a Gantt chart?
For continuous work with no end date, for genuinely exploratory work that cannot be sequenced honestly, and for small projects where maintaining the chart costs more than it returns.
How often should a Gantt chart be updated?
Weekly for most projects. Mark actual progress, adjust what moved, and re-examine the critical path. An un-updated chart stops being a plan and becomes a record of an old assumption.
Sujan Sharma is a content writer at Taskzin with a strong focus on productivity systems, task management, workflow optimization, team collaboration, and SaaS technology. He creates research-driven, practical content that helps professionals and growing teams improve operational efficiency, streamline processes, and make informed decisions about modern work management tools.
All posts by Sujan Sharma

Comments