Gantt Chart Template
A Gantt chart template with a worked twelve-week example, covering what a Gantt chart is actually for, the four dependency types, how the critical path works, how to build one that stays accurate, and common mistakes.


A Gantt chart shows what happens when, what depends on what, and — through the critical path — which delays actually matter. Its value is not the bars; it is the dependencies, because without them a Gantt chart is a decorated list of dates. Most Gantt charts fail because someone drew bars without linking them, so nothing recalculates when reality changes.
The template below covers the structure, a worked example, and how to keep the chart accurate rather than decorative.
What a Gantt Chart Is Actually For

A Gantt chart answers one question well: if this slips, what else moves?
Showing sequence and consequence
The chart exists to make consequence visible. When the design phase runs a week late, a properly linked Gantt shows immediately which downstream work moves and whether the end date changes.
That is the whole value. A stakeholder asking "what does a two-week delay actually cost us" gets an answer in seconds rather than a guess.
What it is not for
It is not a task management system. Day-to-day work — who is doing what today, what is blocked, what is in review — belongs on a board or a list.
It is also not a commitment device. A Gantt chart is a model of intent, and treating every bar as a promise produces defensive padding on every task.
When you do not need one
Continuous work with no meaningful sequence — support queues, ongoing content production, most Kanban-style delivery — gains nothing from a Gantt chart.
If nothing in your work genuinely blocks anything else, a timeline adds ceremony without insight.
Use a board instead.
The Gantt Chart Template
The columns that matter, before anything is drawn.
Column Purpose Notes
What is the critical path?
Phase or deliverable level, not daily tasks Owner One named person Not a team Start date When it can begin Usually derived from dependencies
Duration Working days Estimate effort span, not calendar convenience End date Calculated Should not be typed manually Depends on Which task must complete first The most important column Dependency type FS, SS, FF or SF Finish-to-start covers most cases Milestone Yes/no Zero duration, marks a checkpoint % complete Progress For tracking against the baseline
A Worked Example
A website redesign across twelve weeks, showing how dependencies drive dates.
Task Owner Duration Depends on Notes Discovery and requirements Project lead 10 days — Start of project Milestone:
requirements signed off Head of Marketing 0 Discovery Gate — nothing proceeds without this Information architecture Designer 8 days Requirements signed off
Visual design Designer 15 days IA (FS) On the critical path Copywriting Content lead 12 days IA (SS, start together) Parallel with design Legal review of copy Legal 5 days Copywriting Has 10 days float Front-end build Developer 20 days Visual design On the critical path CMS integration Developer 8 days Front-end build (SS +10 days) Overlaps deliberately Content loading Content lead 5 days CMS integration, legal review Two predecessors QA and accessibility testing QA 8 days Content loading On the critical path Milestone:
go/no-go Head of Marketing 0 QA complete
Launch Developer 1 day Go/no-go
Critical path: Discovery → Requirements → IA → Visual design → Front-end build → CMS → Content loading → QA → Launch. Legal review has float and can slip 10 days without affecting the end date.
Dependencies and the Critical Path
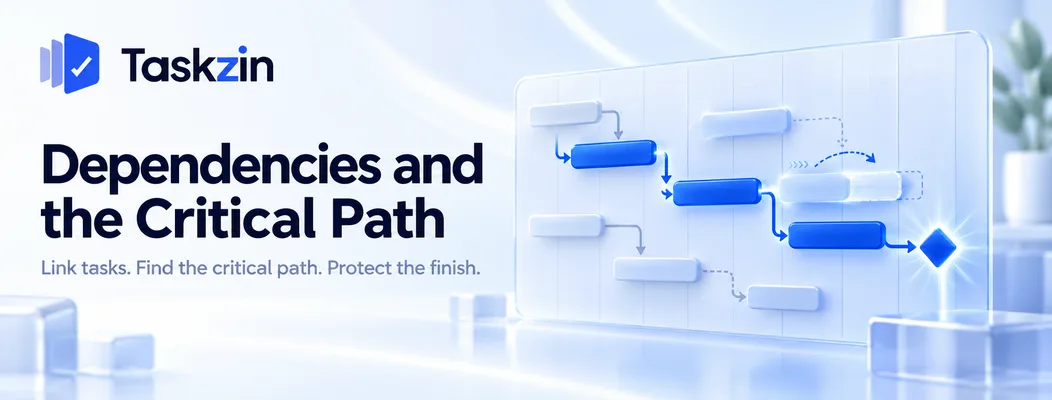
Dependency types describe how tasks relate; the critical path tells you which delays actually cost you time.
The four dependency types
Finish-to-start: B cannot begin until A finishes. This covers the large majority of real dependencies.
Start-to-start: B cannot begin until A begins — useful for work that runs in parallel with an offset, like copywriting starting alongside design.
Finish-to-finish: B cannot finish until A finishes. Start-to-finish is rare and usually indicates a modelling error.
Most schedules need only finish-to-start and occasionally start-to-start. Reaching for the exotic types is usually a sign the tasks are wrong.
What the critical path tells you
The critical path is the longest chain of dependent tasks. Any delay on it delays the project; delays elsewhere consume float without moving the end date.
This is genuinely actionable. It tells you where to focus attention, where to add resource, and which delays you can absorb without concern. In the example above, legal review slipping a week is irrelevant; visual design slipping a week costs a week of the project.
Why manual Gantt charts go stale
A Gantt chart drawn in a spreadsheet or slide has no dependency logic. When something moves, someone must manually redraw every downstream bar and recalculate the critical path.
Nobody does this reliably. Within three weeks the chart shows what was planned rather than what is happening. A tool where dependencies recalculate the critical path automatically when a date changes removes the maintenance burden entirely, which is the difference between a chart that stays true and one that becomes decoration.
Building One That Stays Accurate
Place milestones first, add buffer where the uncertainty actually is, and baseline before work begins.
Start with milestones, then fill in
Identify six to ten milestones — points where something is genuinely complete and reviewable — then work out the tasks between them.
Building bottom-up from a task list produces a chart with a hundred bars and no shape.
Milestones give stakeholders something to track and keep the chart at a level people can read.
Add buffer where uncertainty is, not at the end
Padding every task individually hides the buffer and encourages it to be consumed silently. A single buffer at the end gets cut first when the schedule is challenged.
Put buffer explicitly in front of the milestones that follow genuinely uncertain work — a new integration, an external dependency, a first-time process. Naming it as buffer makes it defensible.
Baseline it before work starts
Record the original plan before work begins, then track actuals against it.
Without a baseline you cannot tell whether you are late — only what the current plan says, which has been quietly updated. The comparison between planned and actual is what makes the next project's estimates better.
Common Gantt Chart Mistakes
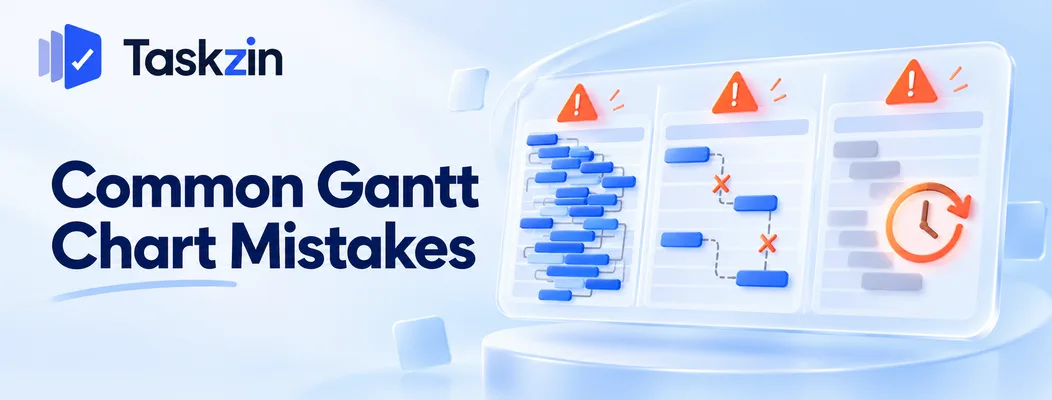
Three failures: excessive detail, bars without dependencies, and a chart nobody updates.
Too much detail
A hundred-row Gantt chart is unmaintainable and unreadable. Stakeholders cannot find the shape, and every small change requires an update.
Keep the chart at phase and deliverable level — twenty to forty rows for most projects. Daily tasks belong on a board, linked to the phase they sit under.
No dependencies, just bars
The most common Gantt chart in existence: coloured bars placed by hand at plausible dates, with no relationships between them.
It looks like a schedule and behaves like a picture. Nothing recalculates, no critical path exists, and the chart cannot answer the one question it is for.
Never updating it
A chart created at kickoff and never revisited becomes actively misleading — worse than no chart, because people trust it.
Update it as work completes, and let the dependencies do the recalculation. If updating is manual and painful, that is the signal to move it into a tool rather than to update it less often.
Frequently asked
What is a Gantt chart?
A horizontal bar chart showing project tasks against time, with dependencies linking them, so you can see sequence and what a delay in one task does to everything downstream.
What should a Gantt chart include?
Task names at phase or deliverable level, one owner each, durations, dependencies with their type, milestones, and percent complete tracked against a baseline.
What is the critical path?
The longest chain of dependent tasks. Delays on it push the project end date; delays elsewhere consume float without affecting the finish.
What are the four dependency types?
Finish-to-start, start-to-start, finish-to-finish and start-to-finish. Most real schedules need only the first and occasionally the second.
How detailed should a Gantt chart be?
Twenty to forty rows for most projects, at phase and deliverable level. Hundred-row charts are unreadable and unmaintainable — daily tasks belong on a board.
Can you make a Gantt chart in a spreadsheet?
You can draw one, but it will have no dependency logic, so nothing recalculates when dates move and there is no critical path. It becomes inaccurate within weeks.
When should you not use a Gantt chart?
When work is continuous with no real sequence — support queues, ongoing production, most Kanban delivery. If nothing genuinely blocks anything else, a board is more useful.
Sujan Sharma is a content writer at Taskzin with a strong focus on productivity systems, task management, workflow optimization, team collaboration, and SaaS technology. He creates research-driven, practical content that helps professionals and growing teams improve operational efficiency, streamline processes, and make informed decisions about modern work management tools.
All posts by Sujan Sharma

Comments